Charts of the Week
Current economic trends from 14 to 18 September 2020: electricity consumption, traffic of electronically tolled vehicles, construction, labour market, wages and current account
According to the available data for the middle of September, freight traffic was, as in the last few weeks, around a tenth lower than before the epidemic, while electricity consumption came close to the level of the same period of last year. In July, employment remained at almost the same level as in June. Year on year, employment declined the most in sectors that have been most affected by the containment measures. In August, unemployment fell slightly as a result of higher economic activity, but also under the impact of measures in the area of the labour market. Construction activity strengthened in July for the first time since February, but remained considerably lower than before the epidemic.
Electricity consumption, September 2020
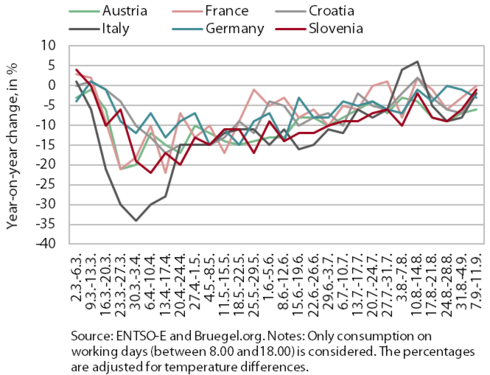
In the second week of September, weekly electricity consumption came very close to last year’s level. Year on year, it was only 1% lower, which is the smallest year-on-year weekly decline since the declaration of the epidemic. Consumption in Slovenia’s main trading partners was also almost at last year’s levels, except in Austria, where it was still 6% lower year on year.
Traffic of electronically tolled vehicles on Slovenian motorways, September 2020
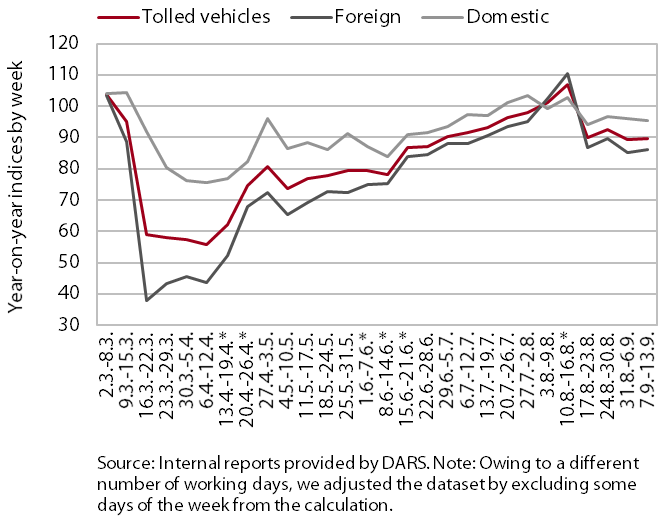
In September, freight traffic on Slovenian motorways was a tenth lower than before the epidemic. After falling sharply with the declaration of the epidemic, it started to increased more strongly again in the middle of June. By mid-August, it was already 6% higher year on year (adjusted for public holidays). Then it declined again and was 10% below the comparable 2019 level in the third week of September. The number of kilometres travelled by foreign hauliers fell more sharply (by 14%) than that travelled by domestic hauliers (by 5%).
Construction, July 2020
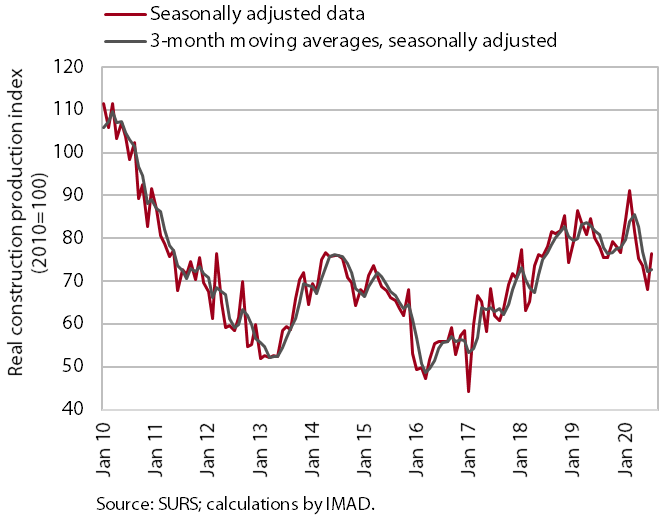
After five consecutive months of decline, construction activity increased in July. Relative to February, the last month before the outbreak of the epidemic, it was 16.1% lower. The lag behind February’s level was the most pronounced in the construction of non-residential buildings (-23.1%), somewhat smaller in the construction of civil-engineering works (-19.4%), while activity in the construction of residential buildings increased (5.2%). In July activity otherwise strengthened at the monthly level in all three construction segments.
The indicators of the stock of contracts and the number of new contracts have strengthened this year and were higher year on year in July. A somewhat worse picture is indicated by data on issued construction permits, which have dropped significantly this year, and business trends in construction, which otherwise improved in the summer months but remained markedly lower than before the outbreak of the epidemic.
Labour market, July – August 2020
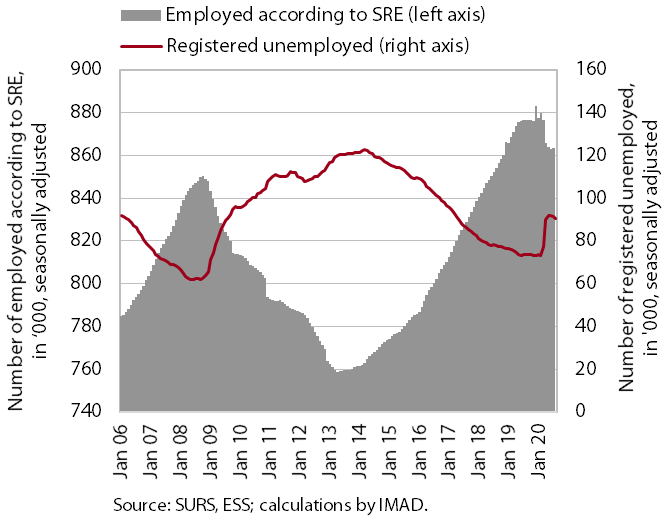
In July, employment remained almost unchanged at the monthly level, while unemployment fell slightly. The number of employed persons was down 1.6% year on year in July, which is similar to the last few months. Administrative and support service activities and accommodation and food service activities still stood out with the largest year-on-year declines (-12.6% and -6.9% respectively). A total of 88,172 persons were unemployed at the end of August, which is 1.4% less than at the end of July. The gradual decline since the end of May is, in addition to the recovery of economic activity, also due to the measures taken to preserve jobs for those still facing a sharp decline in activity due to the crisis. Year on year, unemployment was up 23.2%.
Wages, July 2020
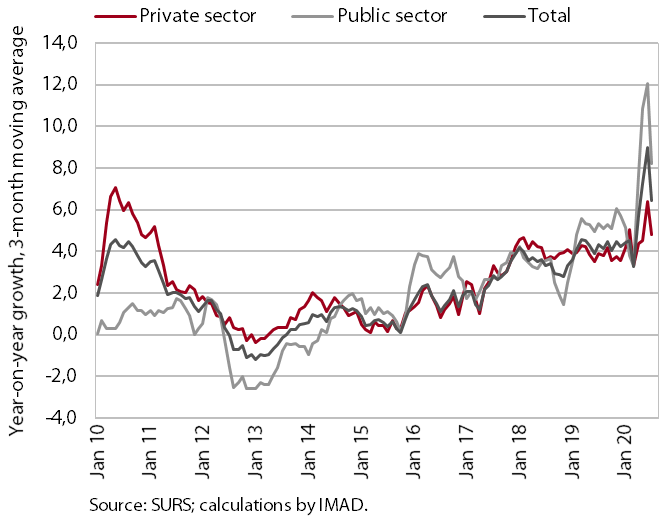
In July, year-on-year growth in the average gross wage strengthened further (4.3%), albeit less than in the last few months. Since April, the strengthening of the year-on-year wage growth has been related to earnings statistics, which were significantly influenced by the relatively high number of workers put on temporary layoff. This has led to a sharp fall in the number of wage recipients and a somewhat smaller decline in wages paid from employers’ resources, which has increased the average wage. The temporary layoff measure had the largest effect on wage growth in the private sector. In the public sector, the stronger year-on-year wage growth in April and May (14.5% on average) was largely due to the extraordinary payment of allowances for harmful working conditions and additional workloads, as well as the payment of the bonus for work in crisis conditions (in accordance with the collective agreement). Since July, extraordinary bonuses have no longer been paid, which was reflected in lower year-on-year wage growth in the public sector – in July wage growth was 4.8%.
Current account, July 2020
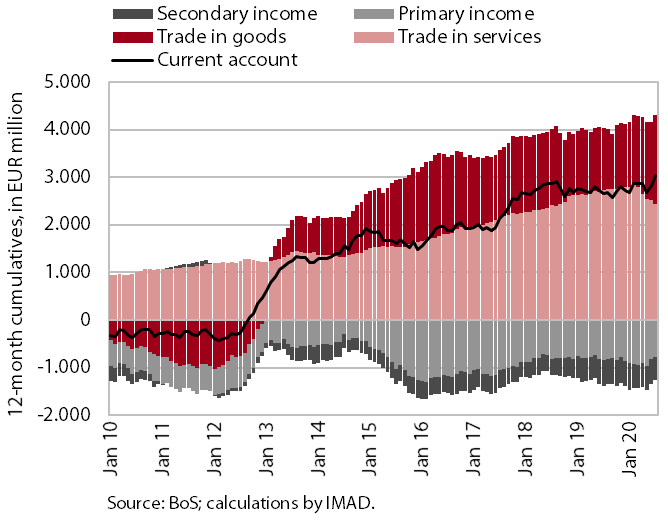
The current account surplus widened further in July. The year-on-year increase in the surplus in current transactions was mainly due to a higher trade surplus in goods, as the real decline in imports was larger than in exports. In addition, the terms of trade improved as well. However, the surplus in trade in services was down again year on year in July. The pronounced fall in trade and the surplus in travel and transport services continued. The deficit in primary income was lower year on year in July, mostly due to lower net outflows of income from equity capital of direct investment. The lower deficit in secondary income was marked by lower VAT- and GNI-based contributions to the EU budget. In the last twelve months to July the current account surplus totalled EUR 3 billion (6.7% of estimated GDP).