Charts of the Week
Charts of the week from 28 November to 2 December 2022: consumer prices, natural gas consumption, value of fiscally verified invoices and other charts
Year-on-year consumer price inflation was 10% in November. Higher prices of food and non-alcoholic beverages had the strongest impact on inflation, and the rise in energy prices also still had a strong effect. Natural gas consumption has declined in recent months due to favourable weather conditions in October, but also due to measures to reduce gas consumption and industry’s reaction to high prices by reducing production output and thus gas consumption. According to preliminary data, consumption in Slovenia from August to the beginning of December was 15% below the comparable average of the last five years, which is in line with EU recommendations. According to data on fiscal verification of invoices, turnover in the second half of November was 16% higher year-on-year in nominal terms, supported by high price growth and last year’s low base related to COVID-19 containment measures. In the third quarter as a whole, real turnover in most trade sectors was similar to the second quarter, whereas it declined in October. Real turnover in market services declined in most activities in the third quarter. Unemployment continued to fall year-on-year in the third quarter (survey data) and the number of persons in employment remained unchanged.
Consumer prices, November 2022
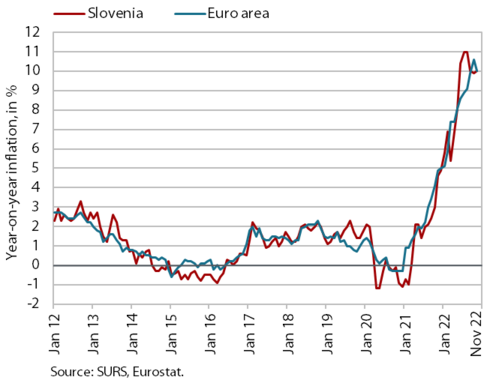
Year-on-year consumer price growth has been relatively stable at around 10% over the past three months and slightly lower than in the summer months. In November, the rise in prices of food and non-alcoholic beverages, which were already 19% higher year-on-year and contributed most to headline inflation (3.1 p.p.), strengthened further. Energy prices also rose at a similar rate and their contribution to inflation was 2.3 p.p. The growth in solid fuel prices, which were already almost 130% higher year-on-year, continued to strengthen. At the current growth, year-on-year growth in oil derivatives prices also strengthened (from 15% in October to about 19%). Heat energy prices fell by around 8.5% year-on-year, given the monthly drop in prices. The slowdown in economic activity, supply chain problems and cost pressures in commodity markets are also contributing to the gradual deceleration in the growth of durable goods prices, which was 8.4%. Growth in non-durable goods prices (3.6%) remained relatively modest. The year-on-year increase in service prices remained slightly below 6% in November.
Natural gas consumption, August–November 2022
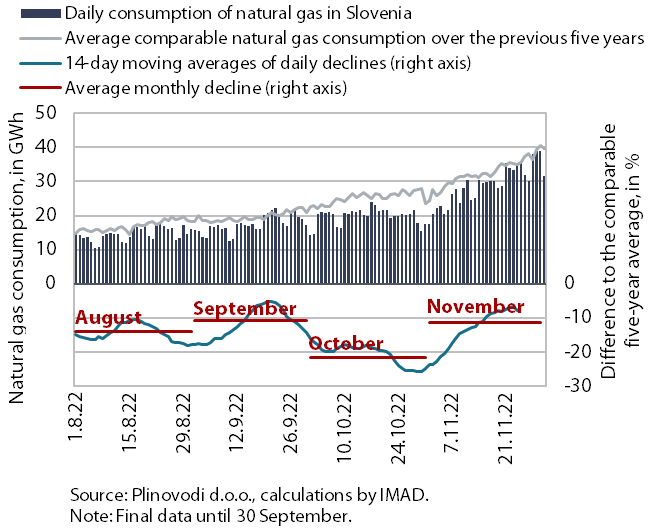
Given the warm weather, natural gas consumption in October was more than 20% below the comparable average consumption over the last five years, while in November it was slightly more than 10% lower. Consumption was lower due to various measures taken by EU Member States to reduce gas consumption, while part of the industry reacted to high gas prices by reducing production output and thus gas consumption. In the second half of October, the warmer-than-average weather additionally contributed to the lower consumption. As temperatures in November were more comparable to the long-term average, the gap to the comparable gas consumption of previous years also narrowed. Before winter, EU Member States managed to almost completely fill their gas storage capacities, exceeding the target of having the capacities 80% full. According to preliminary data, gas consumption in Slovenia from 1 August to 1 December 2022 was about 15% lower than the comparable average consumption over the last five years, which is in line with EU recommendations.
Value of fiscally verified invoices, in nominal terms, 13–26 November 2022
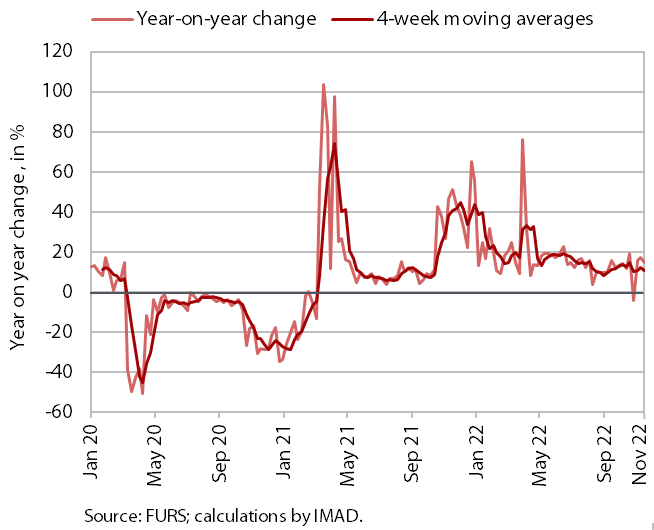
Amid high price growth, the value of fiscally verified invoices between 13 and 26 November 2022 was 16% higher year-on-year in nominal terms and 25% higher than in the same period of 2019. Year-on-year growth was highest since June. The stronger growth was mainly the result of last year’s lower base, because after the vaccinated/tested/recovered rule had been extended to users of most services in September, the containment measures were tightened last November. This led to higher year-on-year nominal growth of turnover in cultural, entertainment, sports and personal services (29%) and in accommodation and food service activities (26%). The latter was the result of a 38% year-on-year increase in turnover in food and beverage service activities, while turnover in accommodation establishments was similar to last year.
Turnover in trade, September–October 2022
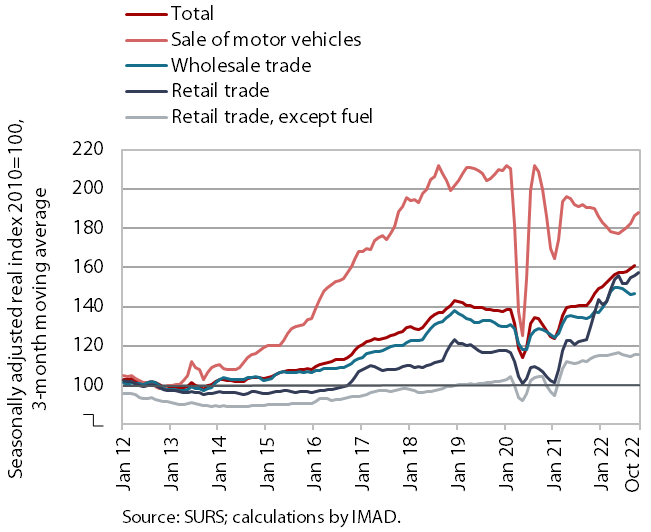
According to preliminary data, turnover fell in real terms in most trade sectors in October. After stagnating in the third quarter, it declined in retail sale of non-food products and retail sale of food, beverages and tobacco. Total turnover in retail trade (excluding automotive fuel) was lower also year-on-year (by 3.1%). According to preliminary data, turnover also remained smaller than a year ago in the sale of motor vehicles, where it fell in October after significant growth in the third quarter. The number of new passenger cars sold, which has yet to reach pre-epidemic levels, continued to fall in October and was almost a fifth lower than a year ago. In the third quarter (compared to the second), turnover also declined in wholesale trade, where year-on-year growth also continued to weaken.
Turnover in market services, September 2022
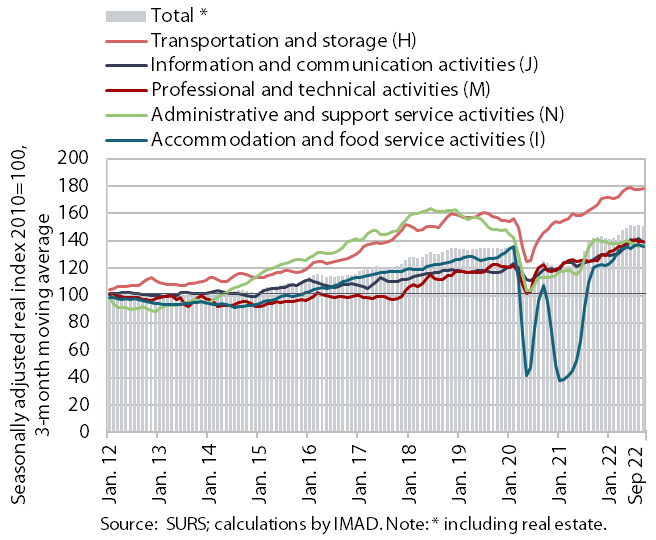
Real turnover declined in most market service activities in the third quarter. After growing in the first half of the year, total turnover in market services fell by 0.6% in current terms, while it increased by 5.1% year-on-year. After the previous high growth, turnover in information and communication activities declined the most in current terms, mainly due to a decline in telecommunication services. It declined again in administrative and support service activities, especially in services that are often outsourced by companies. It also declined in transportation and storage, this time mainly due to a sharper decline in land transport and postal activities. As turnover in architectural and engineering services declined again, a slight decline was also again recorded in professional and technical activities. Turnover in accommodation and food service activities increased in the third quarter as the number of overnight stays continued to rise.
Active and inactive population, Q3 2022
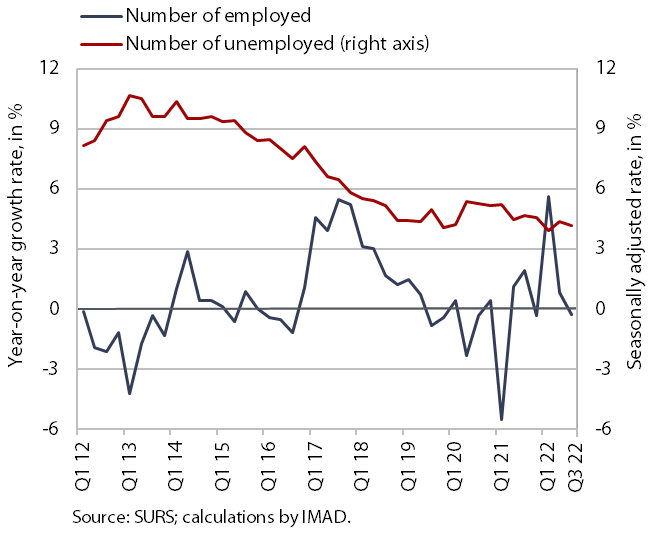
According to the survey data, unemployment fell year-on-year in the third quarter, while the number of persons in employment remained unchanged. According to the original data, 42 thousand persons were unemployed, which is 10.6% less than in the third quarter of last year. The survey unemployment rate fell by 0.5 p.p. year-on-year, to 4%. In our view, the decline in the number of unemployed mainly reflects people’s transition into inactivity, which is normal in times of declining economic activity. Having already been high, the number of persons in employment remained at a similar level to a year ago.