Charts of the Week
Charts of the week from 26 April to 5 May 2023: consumer prices, number of registered unemployed, natural gas consumption, electricity consumption and other charts
Year-on-year consumer price inflation slowed slightly in April, although it was still high at 9.4%. As in previous months, the main contributors to growth were food and non-alcoholic beverage prices, which were 15.8% higher year-on-year in April. Core inflation also remains high. The number of unemployed fell further in April: by 16.3% year-on-year. The number of long-term unemployed also declined, by almost one-third. Gas consumption in April was only about 1% below the comparable consumption of previous years, while electricity consumption was 12% lower year-on-year. Trade in goods continued to decline in the first quarter, mainly due to the uncertain economic situation in Slovenia’s main trading partners and the resulting low foreign demand. In most market services, real turnover increased or remained unchanged in February compared to January. It decreased in accommodation and food service activities and transportation and storage. It also decreased again in most trade sectors. Preliminary data suggest that similar trends continued in March. In the second half of April, nominal year-on-year growth in the value of fiscally verified invoices strengthened, mainly due to the higher number of working days due to the timing of public holidays and higher turnover in retail trade.
Consumer prices, April 2023
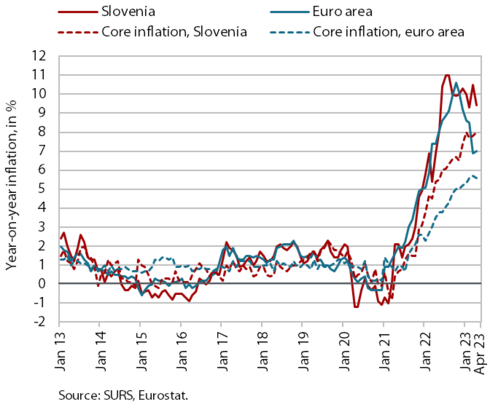
The year-on-year increase in consumer prices slowed slightly in April, but was still quite high at 9.4%. Food and non-alcoholic beverage prices remain the largest contributor to overall growth (2.7 p.p.), although their year-on-year increase slowed to 15.8% (from 19% in March). This is due to a monthly decline in prices (for the first time since November 2021), which we estimate to be driven by the stabilisation of the situation in the energy and input markets (e.g. for fertilisers). The higher base from last April, when food and non-alcoholic beverage prices rose by a full 2.7% on a monthly basis, also contributed significantly to the lower year-on-year growth. The high base also contributed to lower price growth in the group housing, water, electricity, gas and other fuels (13.7%). Growth of durable goods prices has continued to gradually moderate (5.5%), while growth of semi-durable goods prices strengthened in the last two months (6%). The year-on-year price increase in services fluctuated considerably in the last two months, partly due to the rather strong seasonal changes in package holiday prices, and reached almost 8% again in April. Core inflation is also hovering around 8%.
Number of registered unemployed, April 2023
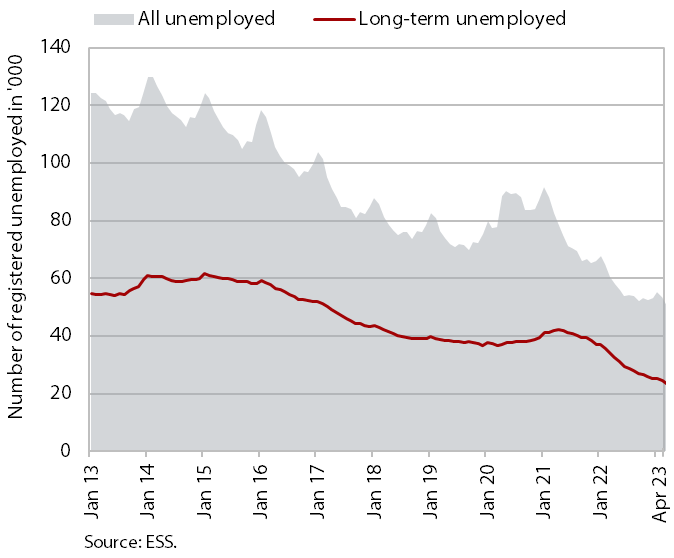
According to the seasonally adjusted data, the monthly decline in the number of registered unemployed was similar in April (-1.5%) as in the previous months. According to original data, 48,904 people were unemployed at the end of April, 3.4% less than at the end of March. Unemployment was down 16.3% year-on-year. Against the backdrop of severe labour shortages, the number of long-term unemployed fell by almost a third and the number of unemployed over 50 fell by 16.4%.
Natural gas consumption, April 2023
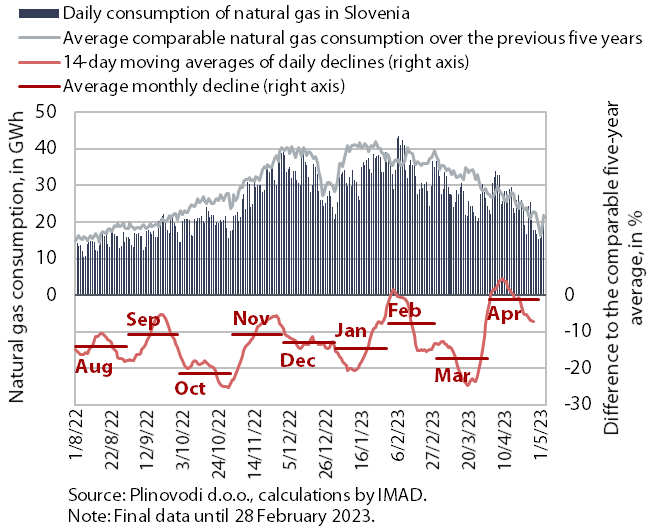
Amid cooler weather, gas consumption in April was only one percent lower than the comparable average consumption over the last five years. The lower gas consumption can be attributed to lower production in some industries as a result of high gas prices and government measures to encourage more rational consumption, while the relatively high consumption in April, which almost reached the average consumption for this month in recent years, was due to lower temperatures that delayed the end of the heating season. EU Member States exceeded the target of reducing gas consumption by at least 15% between August last year and March this year – their gas consumption was almost 18% below the comparable average consumption of the five previous years, while Slovenia reduced its gas consumption by almost 14%, which was only one percentage point below the recommendation. At the end of March, the Council of the EU prolonged the regulation on voluntary gas demand reduction until the end of March 2024, while stipulating that any increase in gas consumption due to the switching from coal to gas in district heating can be deducted from the calculation.
Electricity consumption, April 2023
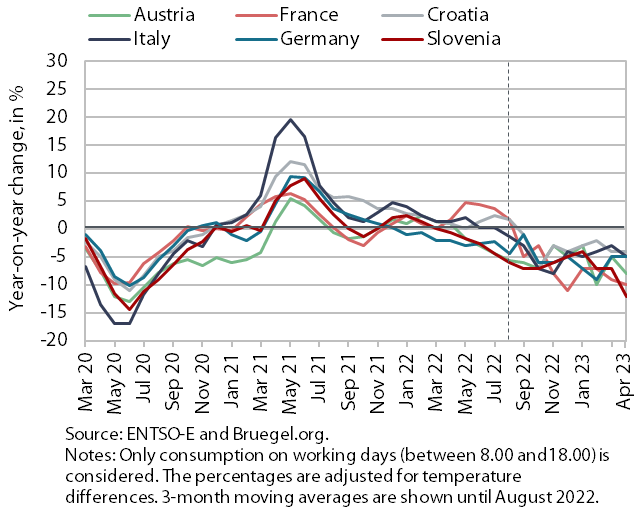
Electricity consumption fell by 12% year-on-year in April, more than in the previous month when it fell by 7%. We estimate that the main reason for the year-on-year decline in consumption was lower consumption in the energy-intensive part of industry. We estimate that the shutdown of primary aluminium production in Talum, which is an energy-intensive company, made a significant contribution to the year-on-year decline in consumption in April. The lower consumption compared to last year may also have been influenced to a lesser extent by lower household consumption due to a more rational energy consumption and the impact of COVID-19 measures on higher base of last year. Slovenia’s main trading partners also recorded a year-on-year decline in consumption in April (France by 10%, Austria by 8%, Italy and Germany by 5% and Croatia by 4%).
Trade in goods – in real terms, March 2023
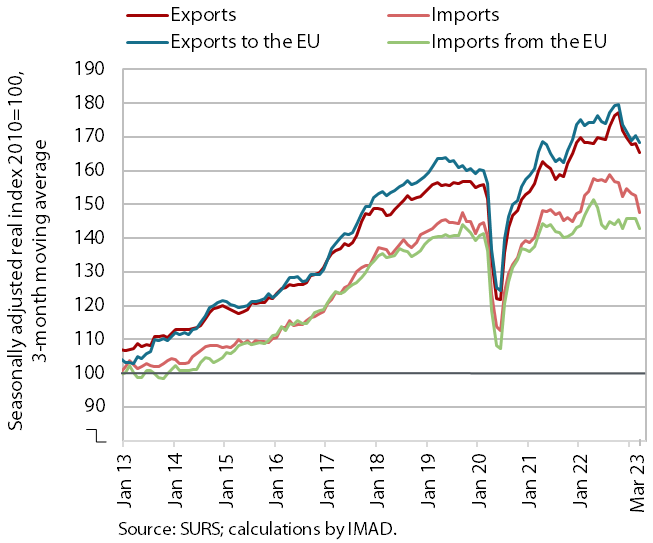
Trade in goods slowed further in current terms in the first quarter of this year. Amid strong monthly fluctuations, real goods exports fell by 2.6% and imports by 4.6% compared to the previous quarter. Exports to EU Member States, especially to Italy and Austria, were also noticeably lower. The decline in recent months was mainly due to lower exports and imports of intermediate goods, while imports of consumer goods were also lower. Year-on-year, exports and imports in the first quarter of this year were lower (by 1.9% and 4.4% respectively). At the beginning of the second quarter, sentiment in export-oriented activities deteriorated somewhat. Also in the second quarter, companies indicate that the main limiting factors to business operations are related to the uncertain economic situation, low foreign demand and the lack of skilled labour.
Value of fiscally verified invoices, in nominal terms, 16–29 April 2023
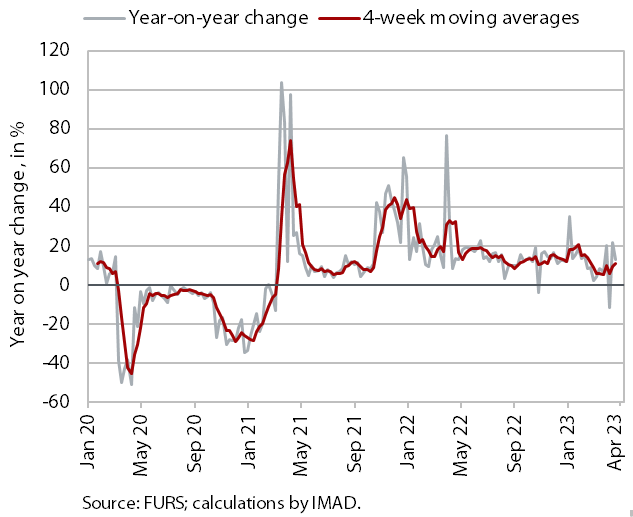
With one more working day, the nominal growth in the value of fiscally verified invoices between 16 and 29 April 2023 strengthened to 17%. The fluctuations in year-on-year growth in April were mainly influenced by the timing of the Easter holidays. With one more working day this year, growth in the last 14-day period accelerated in trade (from 3% to 17%), especially in retail trade (from 1% to 12%), which accounted for almost half of the total value of fiscally verified invoices issued. Turnover growth in tourism-related services (accommodation and food service activities, gambling and betting, sports, creative and arts activities) was similar to the previous 14-day period (14% overall).
Turnover in trade, February–March 2023
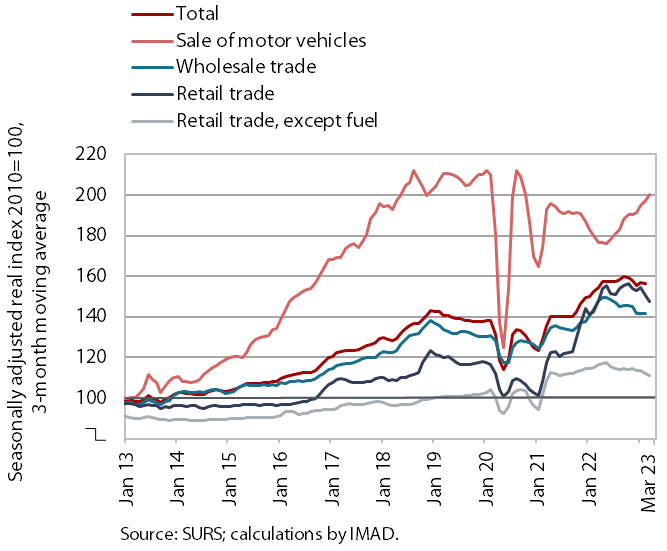
Real turnover in most trade sectors fell further in February and, according to preliminary data, also in March. With the February decline, turnover was also down year-on-year – by about 5% in wholesale trade and in retail sale of food, beverages and tobacco and by 3% in retail sale of non-food products. After a significant monthly increase in the previous two months, turnover in the sale of motor vehicles also fell slightly, but was one tenth higher year-on-year due to the low base related to vehicle supply disruptions last year. According to preliminary SURS data, turnover in retail sale of food, beverages and tobacco and non-food products further declined in March, while turnover in the sale of motor vehicles increased again.
Turnover in market services, February 2023
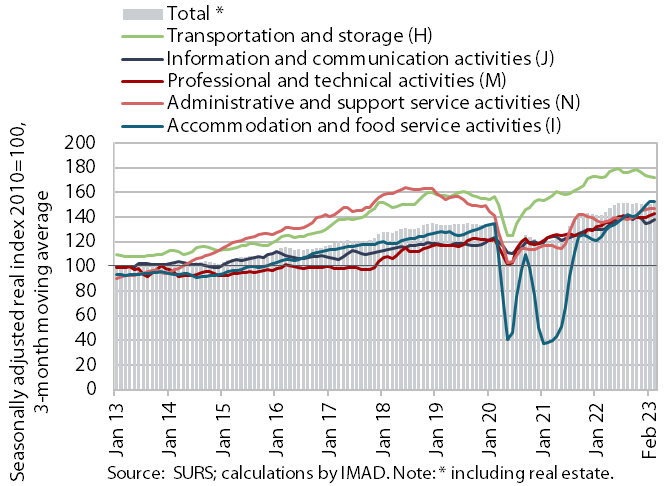
Real turnover growth in market services continued in February. After a recovery at the beginning of the year, total turnover in market services increased by a further 0.9% in current terms. High growth continued in professional and technical activities, with strong turnover growth in architectural and engineering services. Turnover growth in information and communication activities slowed down after recording a significant increase in January. Turnover in administrative and support service activities maintained its high end-2022 level. After high growth in previous months, turnover in accommodation and food service activities decreased. It also continued to decline in transportation and storage (especially in warehousing and storage). In February, total turnover in market services was 5.7% higher in real terms year-on-year. It was higher in most market service activities, except in transportation and storage and real estate activities. Only turnover in administrative and support service activities and employment agencies was still below pre-epidemic levels (compared to February 2019), in the latter by 31%.