Charts of the Week
Charts of the week from 11 to 15 September 2023: manufacturing activities, activity in construction, current account of the balance of payments and electricity consumption by consumption group
In July, the decline in manufacturing output was most pronounced in recent months. The year-on-year decline in production in the first seven months was the sharpest in energy-intensive industries, while growth was recorded only in the more technology-intensive industries. The further contraction in production is indicated by the year-on-year decline in electricity consumption in industry, which intensified in August. Despite a decline in July, year-on-year growth in the value of construction work put in place remained strong in all three segments covered by the construction statistics, with the strongest growth in specialised construction. The current account surplus increased further in July, mainly due to the goods surplus.
Manufacturing activities, July 2023
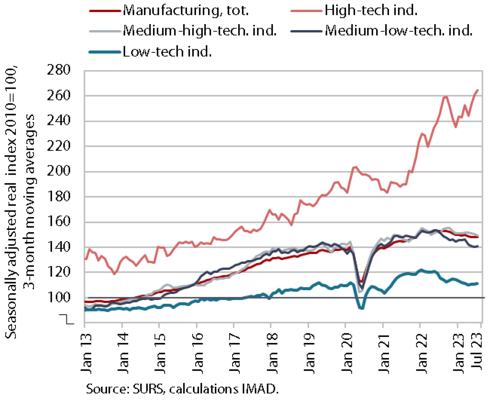
After declining in the second quarter, manufacturing output also contracted in July. In recent months, the decline has been more pronounced in medium-low-technology industries, which are more energy-intensive and mainly produce intermediate goods, mostly for export. The decline in the production in medium-high and low technology industries also continued in July. After rising in previous months, production in high-technology industries also declined. Compared to the first seven months of last year, production was 2.4% lower than a year ago. In all more technology-intensive industries (manufacture of pharmaceuticals and ICT equipment, manufacture of electrical equipment, manufacture of machinery and equipment n.e.c., and manufacture of motor vehicles and other transport equipment) it was higher than a year ago, with the exception of the energy-intensive chemical industry, where the year-on-year decline was the largest (-22.9%). The second largest decline was recorded in the paper industry (-17.5%), which is also energy-intensive, and production was also lower than a year ago in most other, less technology-intensive industries.
Activity in construction, July 2023
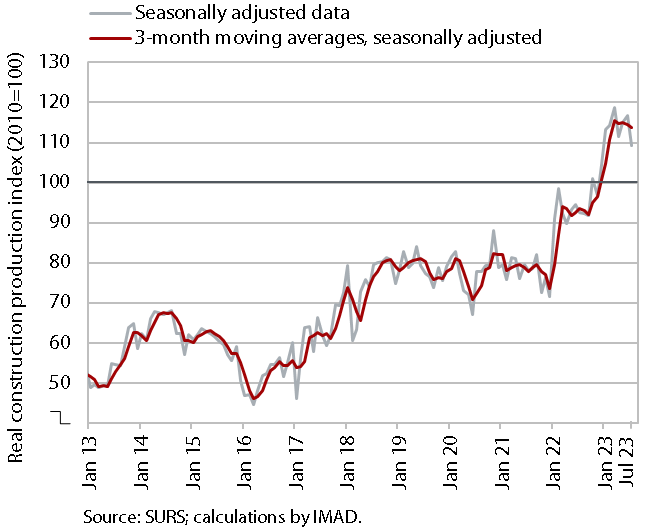
According to data on the value of construction work put in place, construction activity fell in July although it remained significantly higher than last year. After high growth in the value of construction work at the beginning of the year, activity fluctuated around the level reached in the following months. In the first seven months of this year, it was 23% higher year-on-year. In this comparison, activity was higher in all three segments covered by the statistics: most markedly in specialised construction (up 38%), followed by civil engineering and building construction (up 20% and 17% respectively).
Some other data, however, point to much lower growth in construction activity. According to VAT data, the activity of construction companies in the first seven months was 11% higher than last year. Based on data on the value of construction put in place, the difference in the growth of this activity was 12 p.p.
Current account of the balance of payments, July 2023
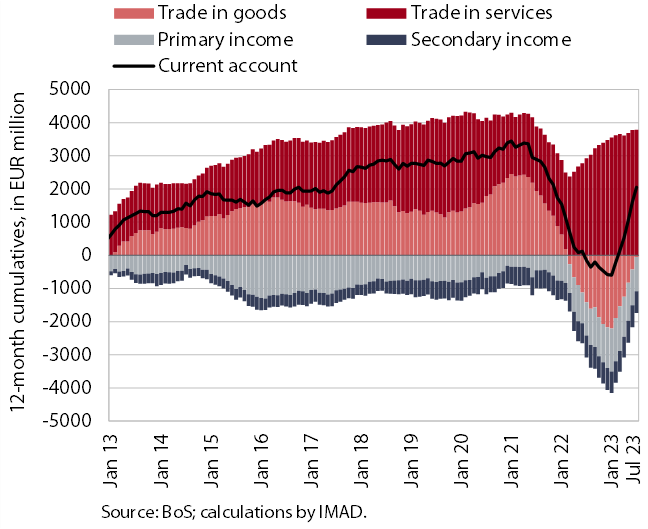
The current account surplus increased further in July. In the last 12 months it amounted to EUR 2.1 billion, compared to a deficit of EUR 151.9 million in the previous 12-month period. The main contributor to this change was the goods trade balance (the annual trade deficit has been declining since February this year), as imports of goods declined amid weak export growth. The surplus in trade in services also increased, especially in trade in travel and transportation services, but also in trade in other services – especially construction services, but also in higher value-added services (telecommunications, computer and information services, research and development services, and financial services). The primary income deficit was higher year-on-year mainly because the income of foreign workers in Slovenia increased more than that of Slovenian workers abroad. Net outflows of income from equity capital (dividends and profits) were also higher.
Electricity consumption by consumption group, August 2023
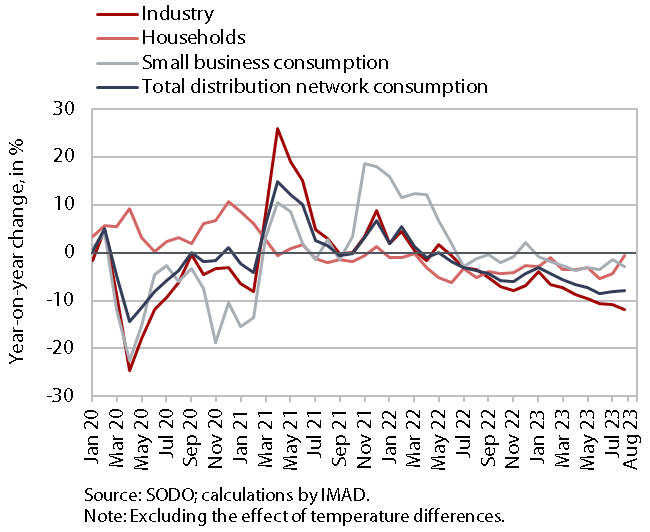
In August, electricity consumption in the distribution network was lower year-on-year in all consumption groups. Industrial consumption fell by 12% year-on-year, slightly more than in the previous months. The decline deepened also due to the floods and their impact on the production processes of some companies. The year-on-year decline in consumption was also somewhat more pronounced among small business consumers (2.8%). For households, the year-on-year decline (0.5%) was lower than in previous months, which could also be related to higher electricity consumption due to the drying of properties after the floods.