Charts of the Week
Current economic trends from 31 August to 4 September 2020: electricity consumption, traffic of electronically tolled vehicles, GDP, active and inactive population and consumer prices
As already indicated by short-term indicators of activity, GDP contracted significantly in the second quarter (by 13% year on year) as a consequence of the outbreak of the COVID-19 epidemic. As expected, the largest decline was recorded in some service activities that were the most affected by the containment measures. According to the Labour Force Survey, labour market conditions deteriorated as well. The number of employed persons was lower year on year, mainly due to a steep decline in the volume of student work. The survey unemployment rate was 1 percentage point higher than in the second quarter of 2019.
Freight traffic on motorways and the consumption of electricity in the economy indicate a relatively fast strengthening of activity in June and July, while in the second half of August both indicator values fell slightly again. In August, consumer prices dropped further year on year, again mainly due to lower prices of oil products.
Electricity consumption, August 2020
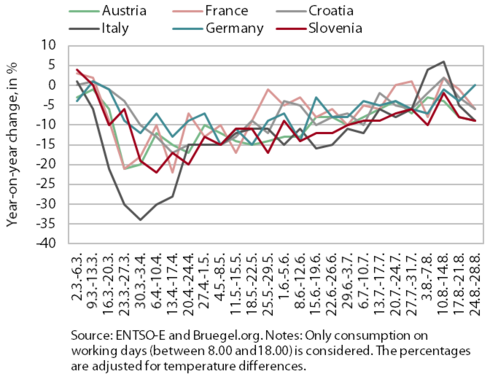
In the last week of August, the year-on-year fall in weekly electricity consumption remained approximately the same as in the previous week. Weekly consumption was 9% lower year on year, the fall being somewhat larger than at the beginning of August. Among Slovenia’s main trading partners, Austria and Italy recorded a similar decline, while the decline in France and Croatia was somewhat smaller (6%). In Germany, electricity consumption reached last year’s level in the last week of August.
Traffic of electronically tolled vehicles on Slovenian motorways, August 2020
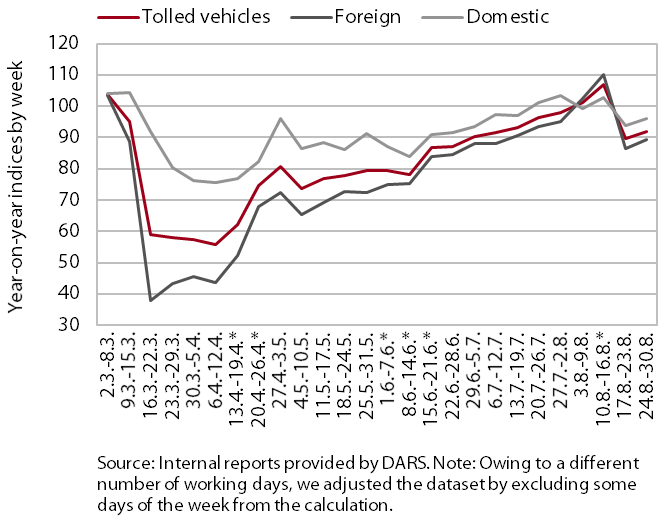
In the second half of August, freight traffic on Slovenian motorways fell below the pre-epidemic level again. After a significant decline with the declaration of the epidemic, freight traffic increased more strongly again from the middle of June. By mid-August it was already 6% higher year on year (adjusted for holidays). Then it declined again and lagged 8% below the comparable 2019 level at the end of August. The distance travelled by domestic and foreign hauliers was 4% and 10% lower year on year respectively.
GDP, Q2 2020
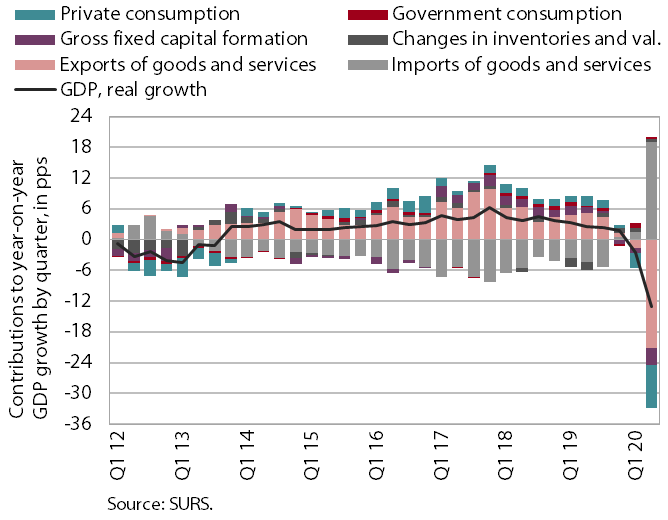
In the second quarter, the year-on-year decline in real GDP deepened strongly, as expected (-13%; in the first quarter -2.5%). With the closure of all non-essential service activities and stores selling non-food products related to the measures to contain the COVID-19 epidemic, the decline was mainly attributable to service activities, especially the group of trade, transportation, and accommodation and food service activities. Due to a decline in orders and interrupted or hampered supply chains, a steep decline was also recorded in manufacturing. Given the restrictions on the movement of people, household consumption also fell significantly. High uncertainty was also reflected in a significant fall in investment in machinery and equipment. Construction investment dropped as well. As a result of a decline in global trade, international trade barriers and severe containment measures in EU countries, exports and imports also fell markedly. Among consumption aggregates, only final government consumption strengthened year on year.
Active and inactive population, Q2 2020
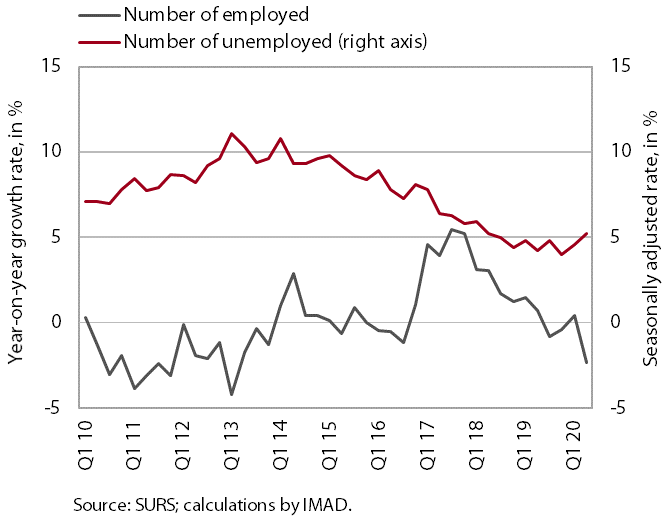
According to the Labour Force Survey data, labour market conditions deteriorated in the second quarter, as expected. The number of employed persons was 1.2% lower year on year. The number of self-employed persons fell even more (-8.8%). Among the employed, there was a pronounced decline in the volume of student work (by more than half), while the number of persons in paid employment remained more or less unchanged. The number of unemployed persons was around a quarter higher year on year, the increase being more pronounced among younger age groups. The ILO unemployment rate was 5.2%, one percentage point higher than in the same period of last year.
Consumer prices, August 2020
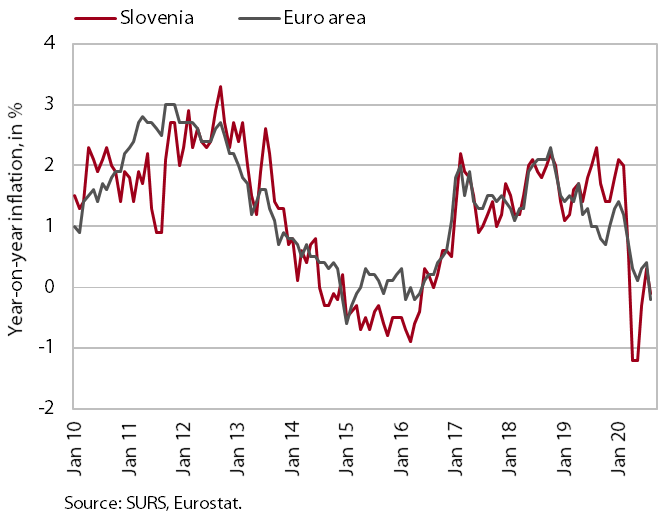
After July’s growth, consumer prices were again lower year on year in August. The decline was again mainly due to lower prices of oil products. The fall in prices of semi-durable goods also deepened again, largely due to the monthly decline in prices of clothing and footwear (1.5%), which had risen in August last year. Prices of durable goods also remained down year on year. A more pronounced decline was prevented by prices of services, whose growth slowed down slightly, but still amounted to almost 2%. Food price growth stabilised at around 3.5% after the decline in June.