Charts of the Week
Current economic trends from 29 August to 2 September 2022: trade in goods – real, turnover in trade, turnover in market services and other charts
Uncertainty in the international environment remains high. In recent months, trade in goods with EU Member States has increased more slowly than trade with other countries. Export expectations continued to decline in August. In the second quarter, real turnover growth continued in all market services. In most trade sectors, turnover stagnated in the second quarter and increased slightly in July. Consumer prices in August remained at the same level as in July and were 11% higher than in August last year, i.e. the same year-on-year increase as in the previous month. The survey unemployment rate was slightly lower in the second quarter than in the same period last year, but the number of unemployed remained unchanged. The number of persons in employment continued to rise.
Trade in goods – real, July 2022
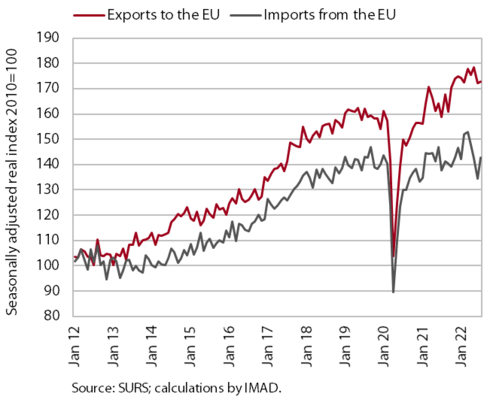
Trade in goods with EU Member States increased slightly at the beginning of the third quarter, but growth was lower than at the beginning of the year; uncertainty remains high. In recent months, trade in goods with EU Member States has increased more slowly than trade with other countries. In our view, this is related to increased uncertainty among our main trading partners in the EU, in particular the slowdown in the growth of activity in manufacturing and rising inflation in these countries. Uncertainty also contributes to the high monthly fluctuations in real imports from EU Member States. In the first seven months of this year, exports to EU Member States increased by 7.2% and imports by 2.2% compared to the same period last year, but year-on-year growth is slowing. Export expectations continued to decline in August.
Turnover in trade, June–July 2022
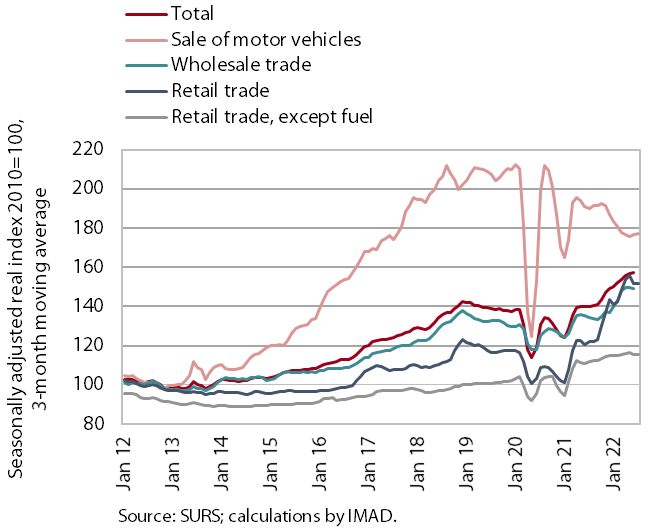
Turnover, which stagnated in most trade sectors in the second quarter, rose slightly in July according to initial data. With all three main sectors stagnating, year-on-year real growth of turnover in the second quarter remained highest in wholesale trade (10%), which we believe was also due to the continued high growth in the sale of primary products, which had already increased significantly last year according to the annual accounts data. Year-on-year growth of turnover in retail trade excluding automotive fuel weakened (to 4.4%), mainly due to lower growth in the sale of non-food products, and for the second consecutive quarter, the sale of food, beverages and tobacco was lower year-on-year. Among non-food products, sales of furniture and household appliances fell year-on-year for the first time since the end of 2020, and sales via mail order or the internet also declined for the second quarter in a row. Turnover in the sale of motor vehicles remained significantly lower year-on-year (-7.2%), but rose slightly in July compared to June according to preliminary data, as did turnover in food, beverages and non-food products.
Turnover in market services, June 2022
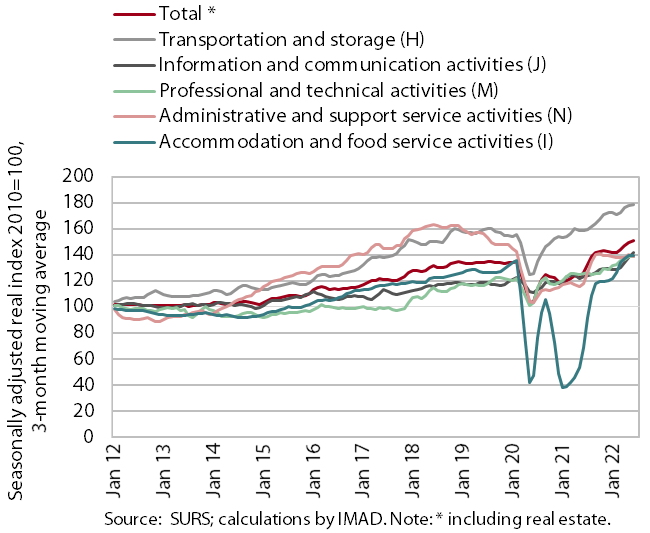
Real turnover growth continued in all service sectors in the second quarter. Total real turnover increased by 4.8% in current terms and by 18.9% year-on-year due to a low base in 2021. Turnover in information and communication activities increased in current terms due to high growth in computer services, where favourable trends in domestic and foreign markets continued, while turnover in telecommunications was maintained at the level reached. Turnover in the accommodation and food service activities continued to grow as the number of overnight stays by tourists and spending by the local population further increased, the latter was also boosted by the redemption of vouchers. Growth of turnover in professional and technical activities slowed slightly. After a brief stagnation at the beginning of the year, turnover in transportation and storage rose again, this time with strong growth in land transport. It rose again slightly in other business activities, with growth continuing in employment agencies and accelerating sharply in travel agencies at the beginning of the summer. However, turnover in these two activities still lags significantly behind the pre-epidemic period (Q2 2019) (by 33% in travel agencies and by 27% in employment agencies).
Consumer prices, August 2022
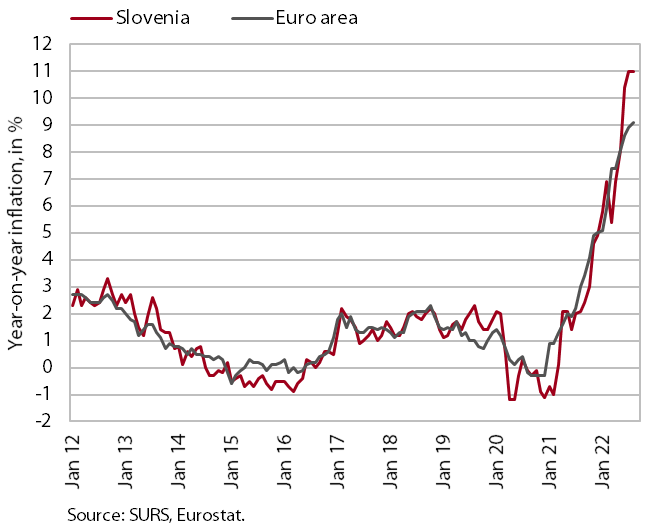
Consumer prices were unchanged on a monthly basis in August, while year-on-year growth remained at 11%. With the monthly decline in oil derivatives prices, the year-on-year increase in energy prices declined slightly, but still exceeded 35%. In recent months, the increase in solid fuel prices, which were two-thirds higher year-on-year, has accelerated significantly. We believe this is to some extent the result of higher demand as households switch to other energy sources and also lower supply due to restrictions on solid fuel exports from some countries. Food prices were 14.1% higher year-on-year and, together with energy, contributed almost three-fifths to overall inflation. The price increase for semi-durable goods remains at about 3%, while the price increase for durable goods declined slightly but is still at about 10%. The year-on-year increase in services prices (5.5%) remained at the levels reached.
Active and inactive population, Q2 2022
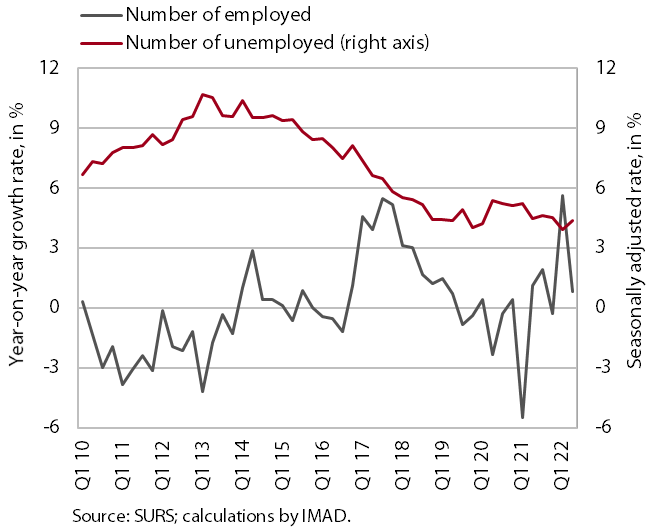
According to the survey data, the labour market situation in the second quarter remained similar to the first quarter and also the same period last year. According to the original data, about 44 thousand people were unemployed, the same as in the second quarter of last year. The survey unemployment rate decreased by 0.1 p.p. year-on-year, to 4.2%. Despite the already very high level, the year-on-year growth in the number of persons in employment (0.8%) continued in the second quarter. We estimate that growth was mainly influenced by the transition of people from inactivity to employment.