Charts of the Week
Current economic trends from 18 July to 18 August 2022: gross domestic product, Trade in goods – real, current account of the balance of payments and other charts
The favourable growth in real GDP in the second quarter was mainly driven by quarterly growth in services exports, with inventories also making an important contribution. Exports of goods and value added in manufacturing also increased, while their year-on-year growth declined. Growth in household consumption and investment remained high year-on-year, although it slowed down. Inflation, which reduces the purchasing power of households, accelerated further in July as energy and food prices continued to rise. As a result of price developments affecting the growth of import prices, the current account surplus is falling; the terms of trade have been deteriorating for one and a half years. According to the figures on the value of construction work put in place, construction activity remained high in the second quarter; compared to previous years, construction of buildings stands out in terms of activity. In May, turnover in market services declined, but still remained significantly higher year-on-year than last year. In June, growth stalled also in certain trade segments. In May, the average wage was again lower year-on-year in real terms. Unemployment remains at a record low. The value of the economic sentiment indicator fell in July for the third month in a row to a value just below the long-term average. Uncertainty in the international environment is also having a negative impact on export expectations, which at the beginning of the third quarter are at their lowest level since the end of 2020. Both point to a weakening of economic activity in the third quarter.
Gross domestic product, Q2 2022
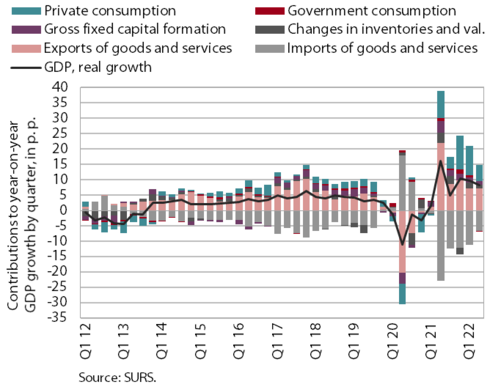
In the second quarter of 2022, gross domestic product (GDP) increased by 0.9% over the first quarter and year-on-year growth (8.2%) remained high. The favourable economic activity in the second quarter was mainly driven by quarter-on-quarter growth in services exports (especially travel services exports), with inventories also making an important contribution. Exports of goods and value added in manufacturing also increased, while their growth declined year-on-year. Household consumption declined quarter-on-quarter due to high prices, especially for energy and food, which have a negative impact on the purchasing power of households. Nevertheless, growth was still high compared to the same period last year. With employment high, it was fuelled by the redemption of vouchers and the easing of containment measures, which boosted consumption of personal and tourism-related services in particular. Investment growth also remained favourable year-on-year, but was hampered by lower expectations and high uncertainty. After a period of strong growth, government consumption declined year-on-year, reflecting a reduction in expenditure on epidemic control and an increase in the growth of prices of goods and services.
Trade in goods – real, May 2022
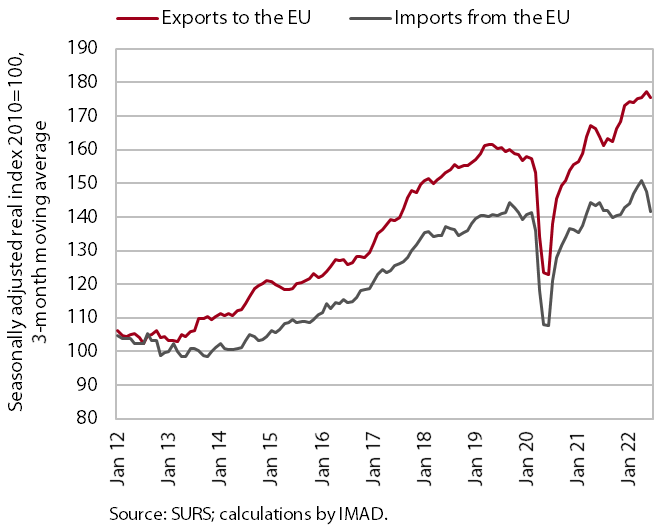
Trade in goods remained at a similar level in the second quarter as in the first quarter, while trade with EU Member States recorded a noticeable decline (seasonally adjusted). Compared to the previous quarter, real exports of goods to EU Member States remained largely unchanged despite significant monthly fluctuations. After growing in the first quarter, real imports from EU Member States have fallen and have been decreasing month-on-month since April. Year-on-year growth of real exports, including to EU Member States, slowed in the second quarter, with the year-on-year decline in imports from EU Member States standing out. Uncertainty in the international environment is also reflected in export expectations, which further fell slightly at the beginning of the third quarter and are at their lowest level since the end of 2020.
Current account of the balance of payments, June 2022
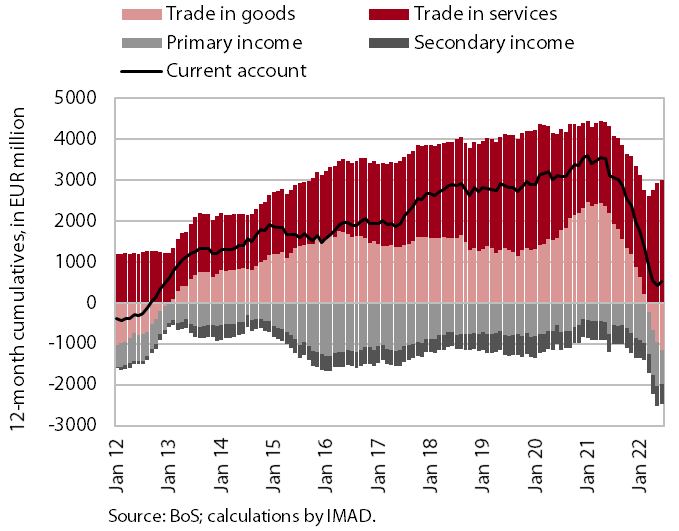
The surplus of the current account of the balance of payments was lower year-on-year in the second quarter; the terms of trade have deteriorated for the sixth quarter in a row. The lower current account surplus is mainly due to the lower trade surplus, which is related mainly to high prices of energy and other primary commodities, which have the largest impact on import price growth. Import and export prices rose year-on-year (by 26.2% and 21.4% respectively) and the terms of trade deteriorated by 3.8%. Trade in services increased in the second quarter with the easing of containment measures. The services surplus was higher year-on-year, mainly due to a larger surplus in travel, transportation and other business services. Net outflows of primary income were lower year-on-year in the second quarter, mainly due to lower payments of dividends and profits to foreign investors. Net outflows of secondary income were higher year-on-year, mainly due to higher GNI- and VAT-based contributions to the EU budget. The 12-month current account surplus on the balance of payments amounted to EUR 536.3 million in June (1.0% of estimated GDP; a deficit of EUR 121.5 million was recorded in the first six months of this year).
Activity in construction, June 2022
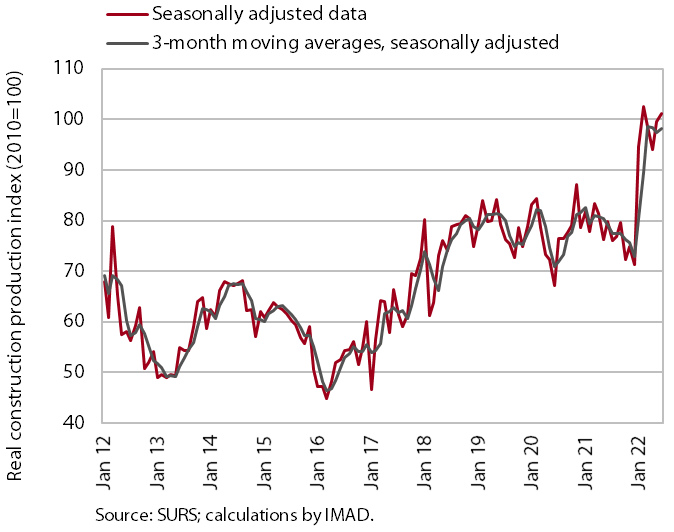
According to figures on the value of construction work put in place, activity in construction remained high in the second quarter. After a strong pick-up in construction activity at the beginning of this year, the value of construction put in place was 24.3% higher in the second quarter than in the same quarter last year. Compared to previous years, construction of buildings stands out in terms of activity. Activity was also high in civil engineering, while it was lower in specialised construction work (installation works, building completion, etc.).
Some other data suggest a significantly lower growth of construction activity. According to data on VAT, the increase of construction activity in the second quarter was about 24 p.p. lower than can be assumed from the data on the value of construction put in place. According to the national accounts figures, the growth in value added was only 7.7% year-on-year, which is 17 p.p. less than according to the data on the value of construction work put in place.
Production volume in manufacturing, June 2022
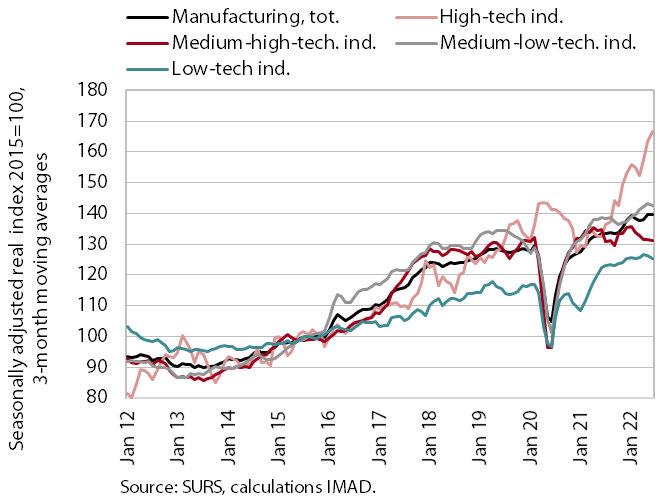
After a modest increase in April and May, manufacturing output fell slightly in June, but was still 1.5% higher in the second quarter. High-technology industries contributed most to quarter-on-quarter growth and output in medium-low-technology industries continued to increase. In low-technology industries, production remained largely unchanged in the first half of the year, while in medium-high-technology industries (especially in the manufacture of motor vehicles) it has been declining since the beginning of the year. In the first half of the year, production in most industries was higher year-on-year (by 5.3% on average), while it was lower especially in the manufacture of motor vehicles and certain less technology intensive industries (mainly leather, repair and installation of machinery and equipment).
Turnover in trade, May–June 2022
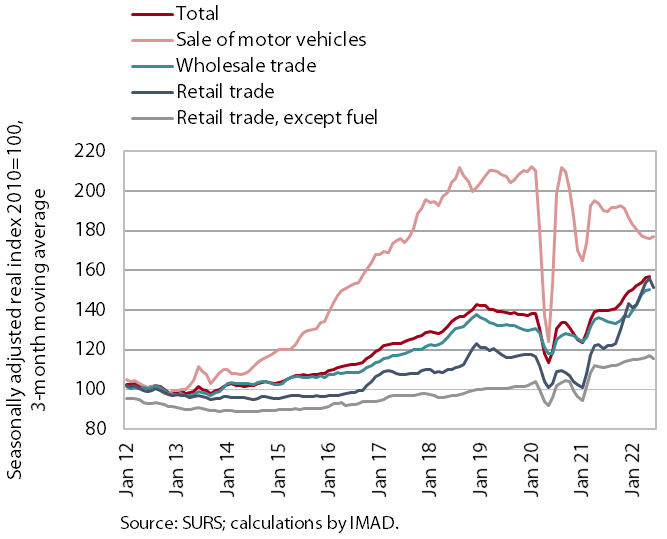
After further growth in May, turnover in most sectors declined in June. In May, turnover increased in all sectors, with the exception of retail sale of automotive fuel, where real turnover has fluctuated strongly in recent months. According to preliminary data, growth stalled in some sectors in June, likely due to more prudent spending in the face of high inflation. In the second quarter, real turnover in the sale of motor vehicles and the retail sale of food, beverages and tobacco products fell compared to the first quarter. Turnover in both sectors was also lower year-on-year, while turnover in retail sale of non-food products was 8% higher year-on-year due to high growth in April and May. Turnover from the retail sale of automotive fuel was also higher year-on-year (by more than 80%, which is far more than can be seen from the data on the volume of petroleum products sold), as was turnover from wholesale trade in the first two months of the second quarter.
Value of fiscally verified invoices – nominal, 24 July–6 August 2022
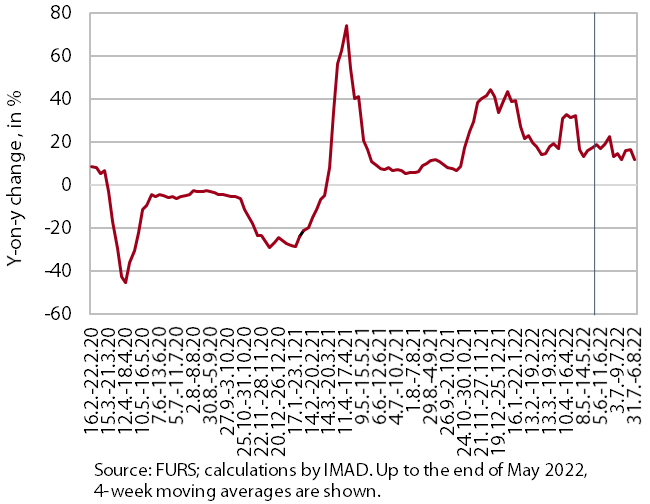
Amid high price growth, the value of fiscally verified invoices between 24 July and 6 August 2022 was 14% higher year-on-year in nominal terms and 18% higher than in the same period of 2019. The year-on-year growth, which was similar to the previous two weeks, was mainly due to the 13% nominal growth of turnover in trade, where about three-quarters of the total value of fiscally verified invoices is issued (while turnover from the sale of motor vehicles was lower year-on-year). Another significant growth factor was also turnover growth in accommodation and food service activities (16%), where more than one-tenth of the total value of fiscally verified invoices is issued. Here, the growth rate decreased compared to previous weeks, mainly due to the dissipation of last year’s low base effect. Compared to the same period of 2019, however, nominal growth remained high (around 30%). Prices in restaurants and hotels were 14% higher this July than in July 2019.
Turnover in market services, May 2022
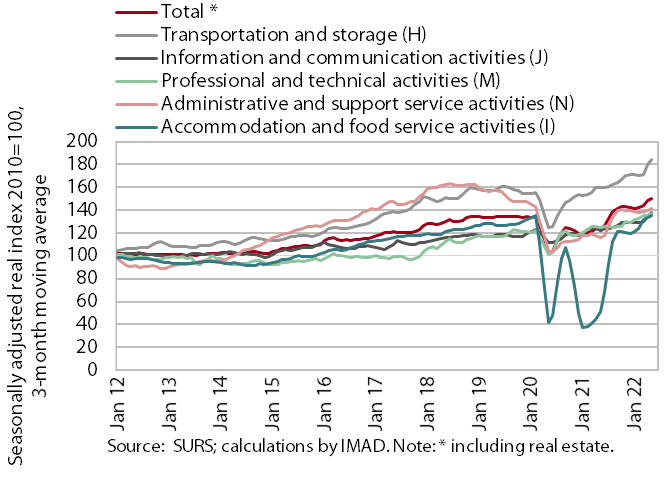
Real turnover in market services fell by 1% in May after three months of growth and was 20.6% higher year-on-year due to a low base. Turnover contracted in both activities that had recorded significant acceleration of growth in the previous month (transportation and storage, and information and communication). In the former activity, the decline was due to a drop in postal activity and land transport; in the latter activity, it was mainly due to lower turnover in telecommunication services, where turnover had mostly increased since December last year. In professional and technical activities, the growth of turnover continued with its renewed increase in architectural and engineering services. With the continued growth in the number of overnight stays, turnover from accommodation and food service activities has increased again. Turnover also increased in other business activities, although the increase here was somewhat lower, since turnover in travel and employment agencies declined again. Compared to the pre-epidemic period (May 2019), turnover in the two activities mentioned was significantly lower, by 40% and 32% respectively.
Economic sentiment, July 2022
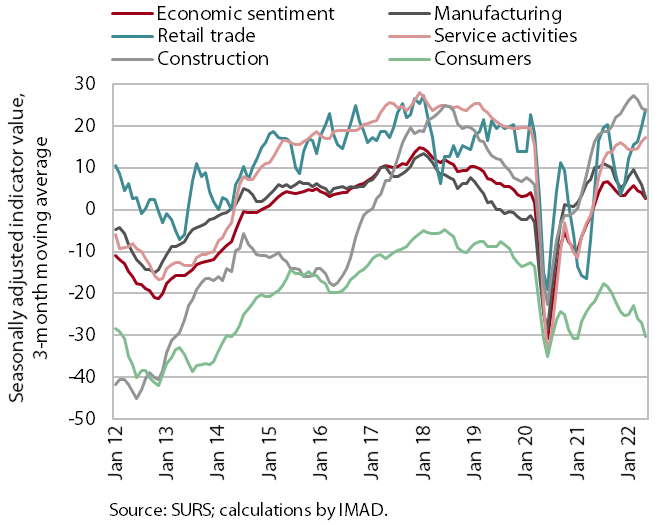
The value of the economic sentiment indicator fell in July for the third month in a row; it remained significantly lower year-on-year and fell just below the long-term average. Compared to June, confidence fell everywhere except in trade, and compared to July last year, it was higher only in trade and services. The consumer confidence indicator remained below the long-term average and since July it has also been lower in manufacturing. Lower confidence among consumers is related to the weakening of household purchasing power due to rising prices, especially for energy and food, while in manufacturing it is related to the current conditions in the international environment (bottlenecks in the supply of raw materials, rising prices for raw materials and energy, and the Russian–Ukrainian war).
Number of registered unemployed persons, July 2022
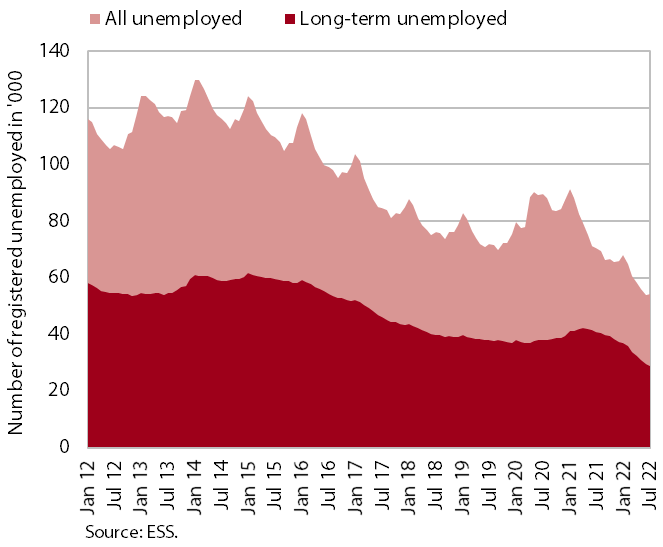
Given the already very low unemployment, the decline in the number of registered unemployed in July was lower than in the previous months (-1.1 %), according to seasonally adjusted data. According to original data, 54,341 people were unemployed at the end of July, 0.9% more than at the end of June and 23.1% fewer than a year earlier. Under conditions of high demand for labour, which is also reflected in the high vacancy rate, the number of long-term unemployed has also been declining since May last year – their number fell by a good quarter year-on-year in July. Among the long-term unemployed, the share of people who have been unemployed for more than two years increased (71%), as they have more difficulties in finding a job than other long-term unemployed.
Average gross wage per employee, May 2022
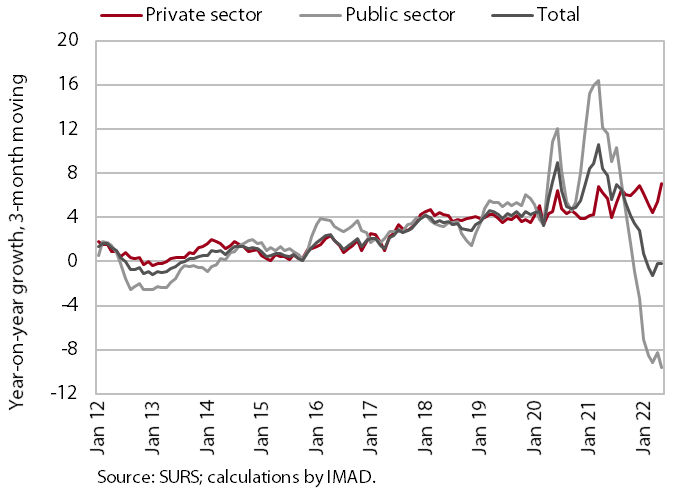
In May, average wages in both the public and private sectors fell year-on-year in real terms (19.1% and 0.5% respectively; 8.3% overall). The year-on-year real growth of public sector wages has been markedly negative since November last year, related to the payment of allowances during the declared epidemic, which has ceased since the middle of last year. In May, the year-on-year decline intensified further due to last year’s high base. Year-on-year growth in the private sector, which was mainly influenced by labour shortages and also good business results, did not decline significantly in real terms, with hotels and restaurants (5.9% in real terms) still recording the highest growth.
Consumer prices, July 2022
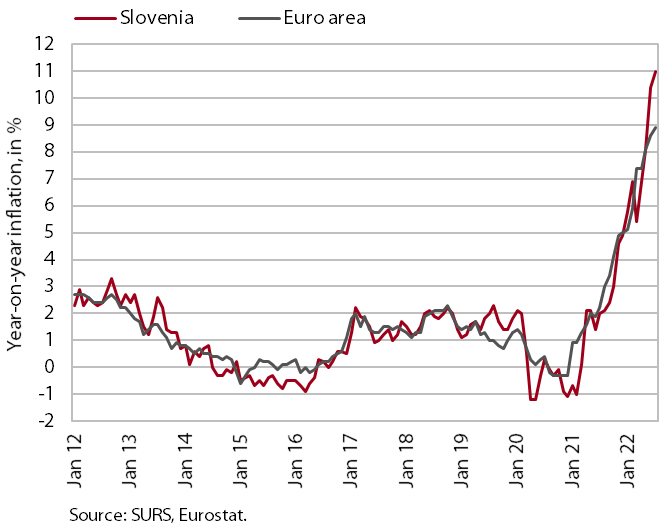
Inflation accelerated again in July due to further year-on-year increases in energy and food prices, reaching 11%. Energy prices rose by almost 40% year-on-year and contributed 4.7 p.p. to inflation. All types of energy products recorded high year-on-year price increases; prices of natural gas and town gas rose the most (by almost 60%) and prices of liquefied petroleum gas the least (25%). In recent months, growth of solid fuel prices has also accelerated sharply. Food prices were 13.5% higher year-on-year and contributed 2.1 p.p. to inflation. The highest price increase (by about 30%) was recorded by the group of oils and fats, and the prices in the group of bread and cereals, milk, meat and fruit also rose by approximately 15%. Both are also a consequence of the Russian–Ukrainian war, as Ukraine is a one of the major global wheat supplier. The year-on-year increase in prices of semi-durable goods remained moderate in July (2.8%). The price increase for durable goods remained at 10.5%, mainly due to higher prices for cars (12.5%) and furniture (14.3%). Prices for services continue to rise at a rate of about 5%, mainly due to higher prices for food service activities, other services related to private vehicles, rents and accommodation.
Electricity consumption, July 2022
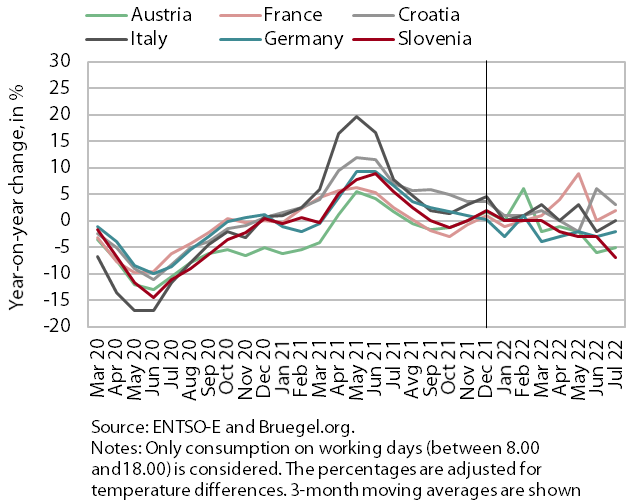
Electricity consumption in July was 7% lower year-on-year, while in June it was 3% lower. We estimate that the lower consumption was mainly affected by the following: high prices, problems with supply chains and material shortages faced by companies, as well as government measures for an efficient use of energy in the public sector. Among Slovenia’s main trading partners, Austria and Germany recorded lower consumption than in July 2021 (-5% and -2% respectively). Consumption in Italy remained unchanged year-on-year in July, while it was higher in France and Croatia (2% and 3% respectively).