Charts of the Week
Current economic trends from 15 to 19 March 2021: electricity consumption, electricity consumption by consumption group, traffic of electronically tolled vehicles, labour market and other charts
The first wave of the epidemic, which started one year ago, had a significant impact on all economic activities. Since then businesses have partly adapted to the new situation. The containment measures during the second wave are focused mainly on service activities. During the second wave, activity in industry and construction remained fairly resilient, which is also corroborated by January’s favourable data. Given the increased freight traffic on Slovenian motorways, favourable developments also continued in the middle of March. Slovenian industrial producer prices are rising, under the impact of relatively favourable industrial activity and hence higher prices of intermediate goods.
Labour market conditions did not deteriorate much during the second wave of the epidemic. Unemployment growth in December and January did not deviate significantly from seasonal increases in the same period of previous years, while in February a seasonal decline in the number of unemployed was already observed, which strengthened slightly in March. At the beginning of the year, the number of employed persons was similar to that in the previous few months. Employment again fell most sharply in accommodation and food service activities, while it increased most in health and social work. The strong year-on-year growth of wages continued in January under a strong impact of crisis allowances in the public sector.
Electricity consumption, March 2021
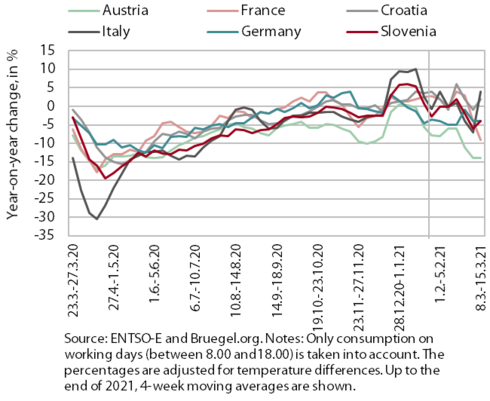
The year-on-year decline in electricity consumption in the second week of March was somewhat smaller than a week earlier. After the year-on-year fall in consumption deepened to 6% at the beginning of March due to the renewed tightening of measures in the Obalno-kraška region, it decreased to 4% in the second week of March under the impact of the additional easing of measures in two regions (opening of bar terraces and gardens). Among our main trading partners, the year-on-year fall in consumption remained largest in Austria (14%); in France it was 9% and in Germany 4%. In Italy, consumption was up 4% year on year, mainly due to last year’s low consumption at the beginning of the full lockdown in the week of March 9 (in comparison with the second week of March 2019, it was 2% lower). In Croatia, electricity consumption was up 2% year on year.
Electricity consumption by consumption group, February 2021
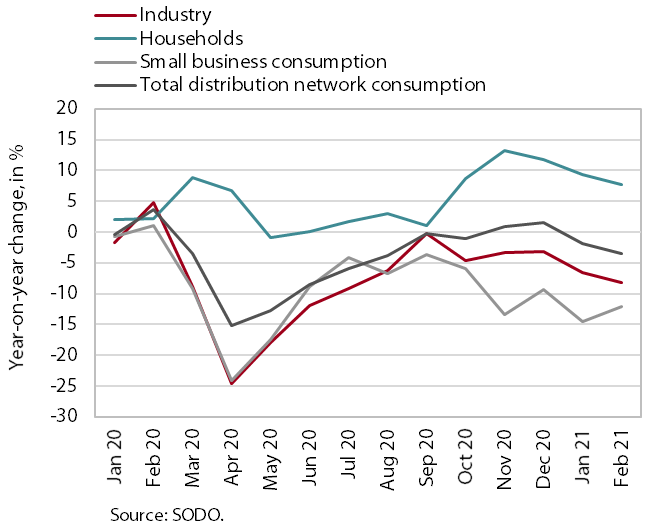
In February, industrial electricity consumption declined slightly more year on year than in the previous months of the second wave of the epidemic; small business electricity consumption fell less. In February, industrial electricity consumption was by 8.1% lower year on year (in the last three months of 2020 as a whole, by 3.7%; in January this year, by 6.5%). The year-on-year fall in electricity consumption by small business consumers, which mainly include service activities and trade, decreased slightly (12.1%) in February with the partial relaxation of measures, after amounting to around 14% in November and January when non-essential services and shops were closed. On the other hand, household electricity consumption was higher year on year (7.7%) in February, as people spent more time at home due to the epidemic, but the increase was smaller than at the peak of the second wave of the epidemic.
Traffic of electronically tolled vehicles on Slovenian motorways, March 2021
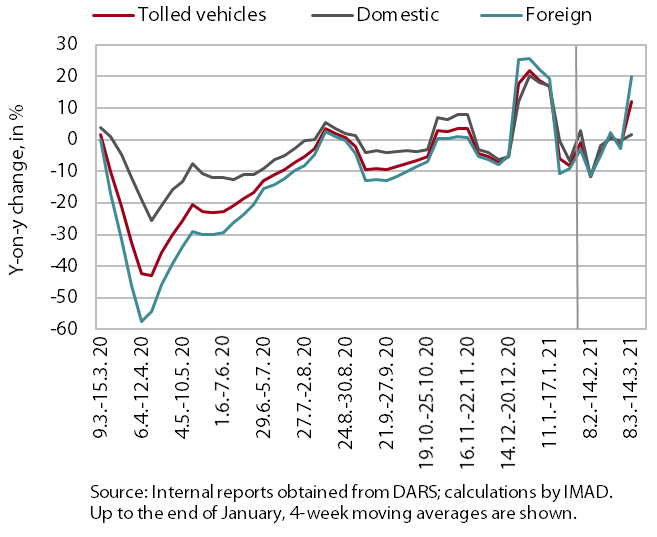
Freight traffic on Slovenian motorways in the second week of March was 12% higher than in the comparable week last year, when the first wave of the epidemic was declared. In the week between 8 and 14 March, domestic vehicle traffic was 2% higher and foreign vehicle traffic 20% higher year on year. The strong year-on-year growth is due not only to a significant increase in the volume of freight traffic in recent weeks, but also to the base effect, as in the same period last year, foreign vehicle traffic dropped significantly due to containment measures adopted at the beginning of the epidemic (domestic vehicle transport fell somewhat later). Freight traffic was around 6% higher relative to the comparable week in 2019.
Labour market, December 2020 – March 2021
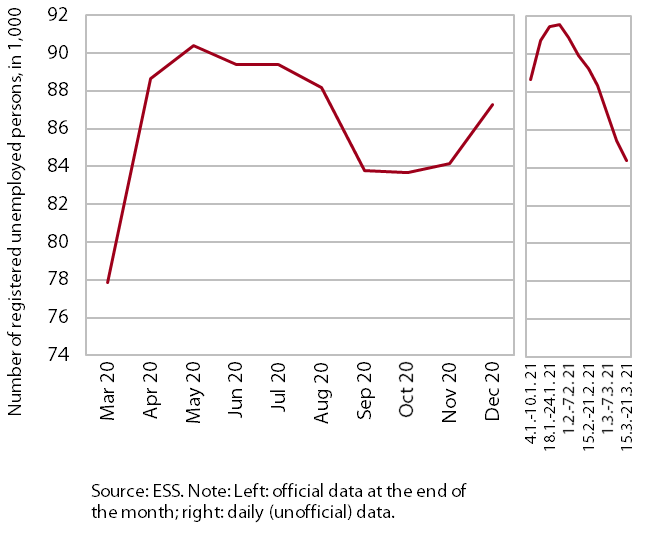
The decline in the number of registered unemployed persons strengthened somewhat further in the first half of March. With intervention measures still in place, December's and January’s growth did not deviate significantly from seasonal increases in the same period of previous years. At the end of January, it came to a halt, and in February, a seasonal fall in unemployment was already observed, which then strengthened somewhat in March. On 18 March, 83,940 persons were unemployed according to ESS unofficial (daily) data, which is 4.7% less than at the end of February and around 8% more than in the same period last year.
The number of employed persons was down 1.5% year on year in January, which is similar to previous months. Employment again fell most sharply in accommodation and food service activities and administrative and support service activities, which were hardest hit by the containment measures, while it increased most in health and social work.
Wages, January 2021
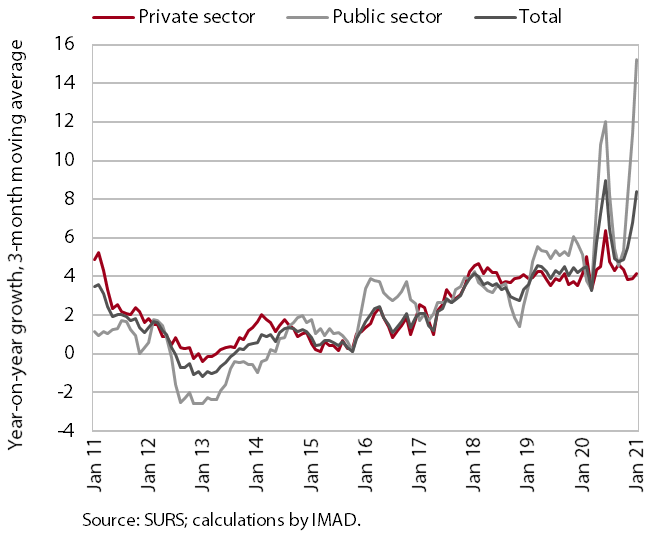
In January, year-on-year wage growth continued; it was still strongly influenced mainly by the payment of crisis allowances in the public sector. With the renewed payment of allowances (the extraordinary payment of allowances for hazardous working conditions and additional workloads and the payment of the bonus for work in crisis conditions in accordance with the collective agreement), year-on-year wage growth in the public sector increased again towards the end of last year and in January this year, the most by far in social work and health (in January, by 41.9%; in the total public sector, by 18.4%). In the private sector, wage growth did not strengthen in the second wave of the epidemic, with the exception of the increase in December (5.3%), which was mainly due to the crisis bonus. In January, wages were again somewhat lower year on year (-3.7%).
Construction, January 2021
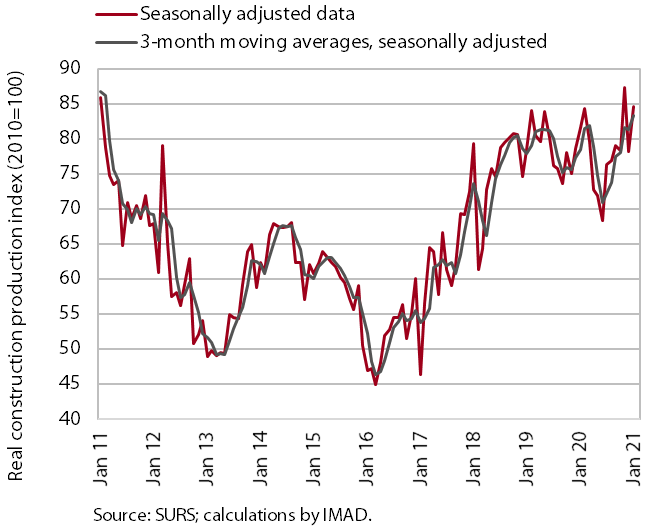
Construction activity increased in January. The value of construction output was up 8.3% and was 4.2% higher than a year before. Compared with 2018 and 2019, in the last few months, activity was considerably higher in non-residential buildings, slightly higher in civil-engineering and at a similar level in specialised construction activities.
Data on the stock of contracts and new contracts in construction do not paint a uniform picture. The value of the stock of contracts, having already been slowly falling since mid-2020, declined sharply in January and was 15% lower year on year. On the other hand, the value of new contracts rose towards the end of 2020 and in January and was around a third higher year on year in the last three months.
Slovenian industrial producer prices, February 2021
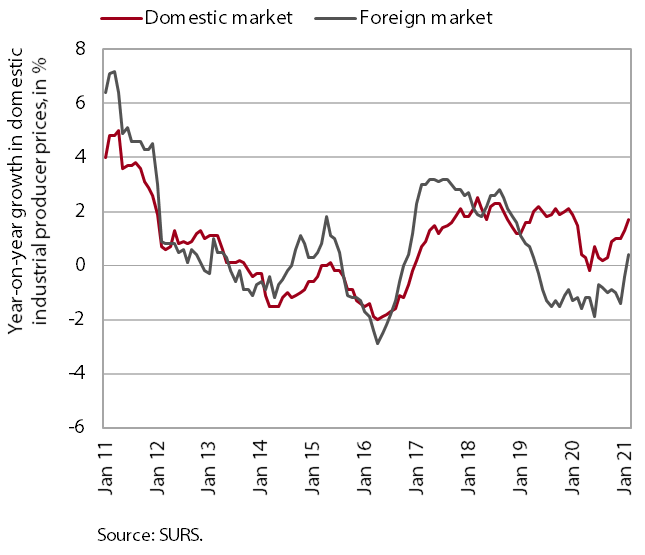
Slovenian industrial producer prices strengthened again in February and were 1% higher year on year. We estimate that, in addition to the relatively favourable activity in industry, their growth was also driven by higher prices of intermediate goods on international markets. Year-on-year growth in prices of industrial products sold on the domestic market thus increased further and was, at 1.7%, the highest since January 2020. Prices of capital and intermediate goods were rising the fastest (3.2% and 2.4% respectively). Year-on-year price growth on foreign markets was more modest (0.4%), mainly as a consequence of a more pronounced decline of prices in the previous year. Current growth in the first two months of this year was even somewhat higher than on the domestic market.
Current account of the balance of payments, January 2021
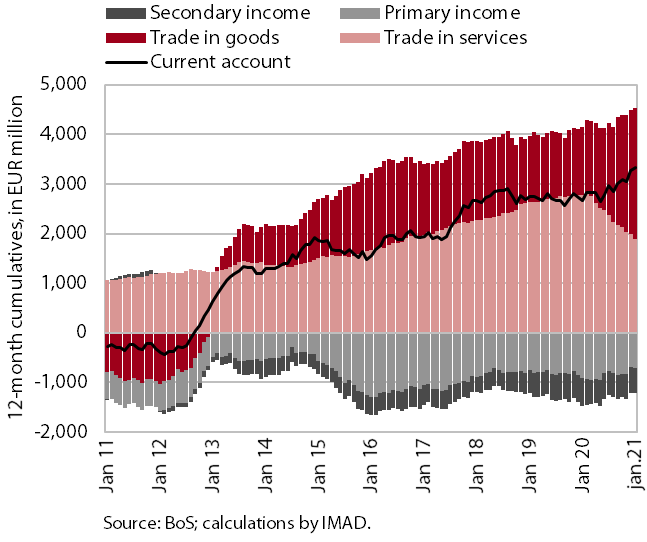
The current account surplus remained high and mostly reflected developments in goods and services trade. The year-on-year higher surplus, which amounted to EUR 3.3 billion in the last 12 months to January (6.9% of estimated GDP), was, amid the improved terms of trade, mainly attributable to a higher surplus in goods trade. The year-on-year increase in the current account surplus was also due to lower net outflows of primary and secondary income. Net outflows of primary income were down year on year owing to a smaller net outflow of income from equity capital of direct investment and higher subsidies from the EU budget for the implementation of the common agricultural and fisheries policy. The decline in net outflows of secondary income was largely a consequence of lower payments of current taxes on income and property and lower payments of social contributions abroad. The surplus in services trade declined further, largely due to a fall in the surplus in the travel segment, which was strongly affected by the epidemic.