Charts of the Week
Current economic trends from 10 to 14 January 2022: production volume in manufacturing, the balance of payments, road and rail freight transport and other data
The end of last year and the beginning of this year were marked by increased economic activity. Turnover based on fiscal verification of invoices at the end of December last year and at the beginning of this year was 60% higher year-on-year and was also higher than turnover at the turn of 2019 to 2020. Electricity consumption by consumption groups as an indicator of economic activity was also higher in December 2021 than in the previous two years in all consumption groups. Manufacturing production increased significantly in November, rising by 11.3% over the past twelve months. Activity in construction, which fluctuates widely across segments from month to month, remained below late 2020 and early 2021 levels in November. However, high price growth in construction services continued due to rising commodity prices and labour shortages. Rising import prices and increased domestic demand have led to a decline in the current account surplus.
Production volume in manufacturing, November 2021
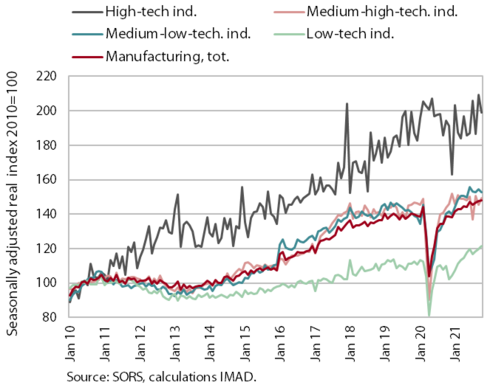
Manufacturing production growth was relatively high again in November after stagnating in the previous month. Growth continued in medium-technology industries, and high-technology industries also recorded an increase. However, growth in low-technology industries came to a halt and even recorded a moderate decline. Year-on-year increase in production volume in manufacturing was again quite high (11.3%), strongest in low-technology industries, mainly due to the low base last year in other manufacturing. The lowest year-on-year growth was again recorded in medium-high technology industries. In the case of the latter, growth was mainly affected by developments in the automotive industry, where production volumes are even lower year-on-year due to supply chain disruptions and uncertainty about the future development of the industry in the context of the green transition.
The balance of payments, November 2021
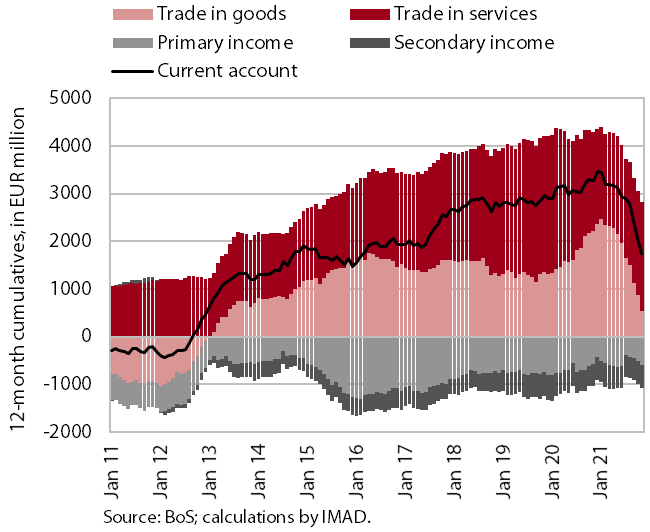
The current account surplus in the 12 months to November 2021 was down year-on-year, totalling EUR 1.8 billion (3.5% of estimated GDP). This was mainly due to a smaller trade surplus as imports of goods grew faster than exports in the face of stronger domestic consumption and deteriorating terms of trade. Primary and secondary income deficits were also higher. Net outflows of primary income continued to rise, mainly due to higher net payments of income on equity. Net outflows of secondary income were higher mainly due to higher VAT- and GNI-based contributions to the EU budget. The surplus in services trade was higher year-on-year, especially in trade in construction services and trade in higher value-added services (research and development services and telecommunications, computer and information services).
Road and rail freight transport – Q3 2021
The volume of road and rail freight transport decreased slightly in the third quarter of 2021, while the volume of road transport remained high. Due to low base before the second wave of the epidemic last year, the volume of road traffic was almost a tenth higher year-on-year and was also slightly higher than in the third quarter of 2019. Compared to the previous quarter, the volume of road transport performed by Slovenian road freight operators abroad increased by 2%, while the volume of road transport performed at least partially on Slovenian territory (exports, imports and domestic transport combined) decreased by 5%. Rail freight transport, which had been declining before the epidemic, increased slightly year-on-year, but was 12% lower than in the same period of the year before the epidemic.
The value of construction output, November 2021
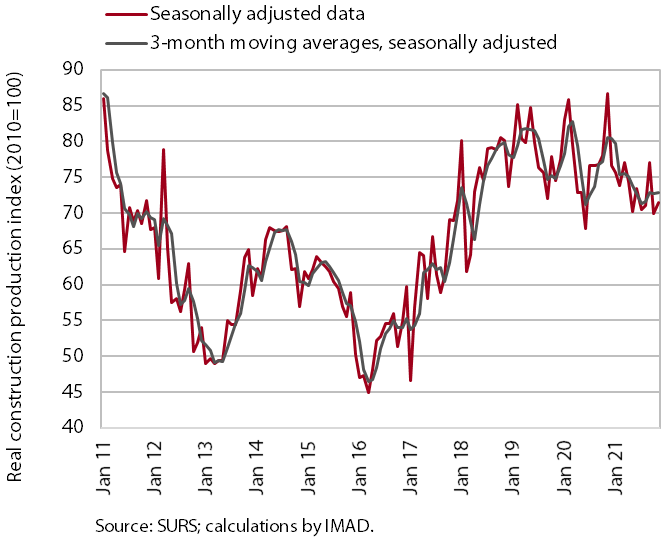
Construction activity increased slightly last November, but was still lower than in late 2020 and early 2021. Activity in the individual construction segments fluctuates strongly from month to month. Activity in civil engineering works and specialised construction remains at the level of the beginning of 2021 due to the aforementioned fluctuations. Activity in residential construction and especially in non-residential construction is declining. The stock of contracts fluctuates similarly from month to month. The latter had risen roughly until July 2021, fallen sharply in August, then risen again in the following months and reached its highest level in recent years in November. Construction prices rose sharply last year under the pressure of rising commodity prices (and shortage of labour). The implicit deflator of the value of completed construction works (used to measure prices in the construction sector) was almost 9% in November 2021, the highest level in the last 12 years.
Turnover based on fiscal verification of invoices, 26 December 2021–8 January 2022
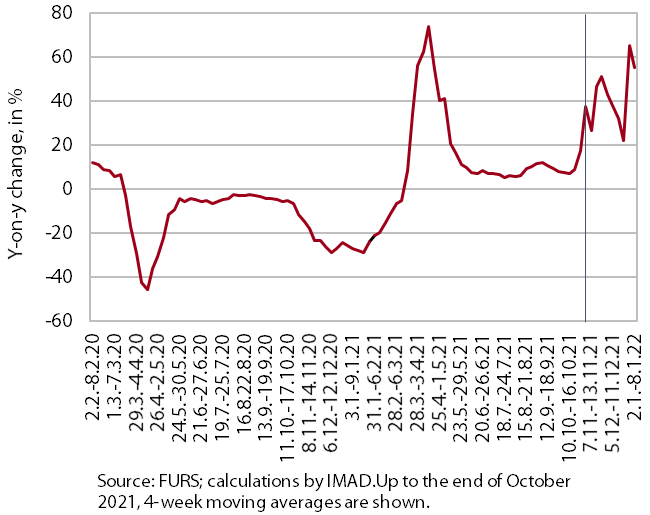
According to data on fiscal verification of invoices, total turnover between 26 December 2021 and 8 January 2022 was 60% higher year-on-year and 8% higher than in the same period before the epidemic. Year-on-year growth doubled compared to the previous two weeks. This is mainly due to a lower base related to the re-closure of non-essential shops and services since the end of 2020 (after a temporary partial relaxation of operating restrictions between 15 and 23 December 2020). This was mainly reflected in higher year-on-year turnover growth in trade and some personal services. Year-on-year growth was still very high in activities that were almost completely shut down in late 2020 and early 2021 – mainly tourism-related services. Total turnover was also higher than turnover at the turn of 2019 to 2020, mainly due to a tenth higher turnover in trade, while in other services it was below pre-crisis levels.
Electricity consumption by consumption group, December 2021
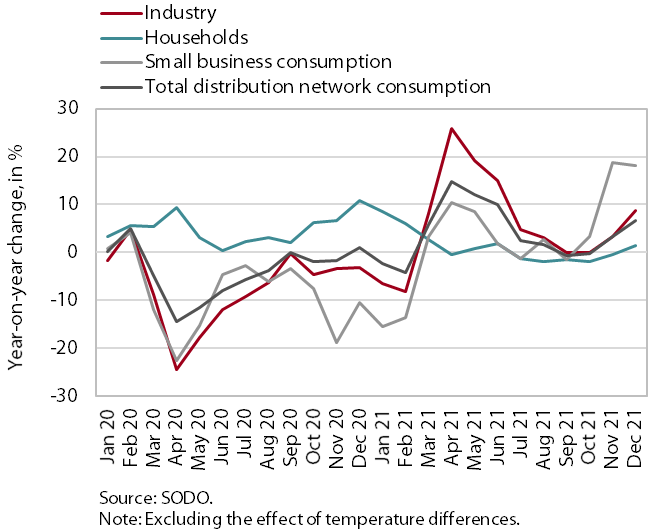
In December 2021, electricity consumption by all consumption groups was higher than in December 2019 and 2020. Compared to December 2020, industrial consumption increased by 8.8%, partly due to a more favourable timing of holidays from the aspect of the functioning of the industry in December 2021. Significantly higher (by 18.1%) than in December 2020 was small business consumption, which was significantly influenced by the low base in December 2020, when containment measures were in place, restricting trade and services in particular. Household consumption exceeded the December 2020 figure, when the base was already high, by 1.4%. Compared to December 2019, industrial electricity consumption was 5.4% higher and small business electricity consumption was 5.9% higher, mainly due to the more favourable timing of the holidays. Compared to December 2019, household consumption increased by 12.3% due to epidemic-related reasons.