Charts of the Week
Charts of the week from 9 to 13 January 2023: value of fiscally verified invoices, electricity consumption by consumption group, production volume in manufacturing and other charts
In the last few weeks, the nominal value of fiscally verified invoices has been around 10% higher than the comparable levels a year ago. In December, industrial and household electricity consumption were lower year-on-year, reflecting adjustments in consumption due to high prices, while small business consumption was higher than in the same period of 2021, when COVID-19 containment measures were in place. The slow strengthening of manufacturing activity came to a halt towards the end of the year. Production in most sectors was also lower year-on-year. The value of construction put in place increased significantly in the first 11 months of 2022, exceeding the previous year’s level by 44% in November. The volume of road freight transport decreased significantly again in the third quarter of 2022, while the volume of rail transport remained stable. The significant decline in the current account surplus in the first 11 months of 2022 was mainly due to goods trade balance as imports of goods grew faster than exports.
Value of fiscally verified invoices, in nominal terms, 25 December 2022–7 January 2023
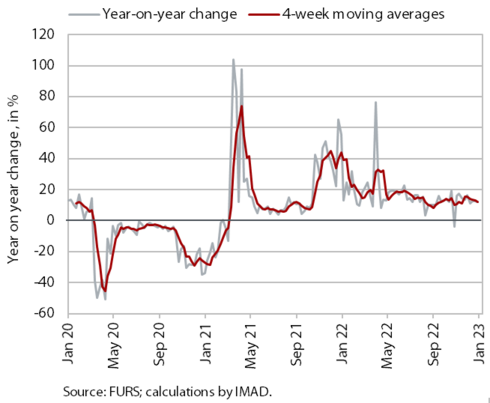
Amid high price growth, the nominal value of fiscally verified invoices between 25 December 2022 and 7 January 2023 was 12% higher year-on-year. About one tenth higher turnover in trade, which accounted for about three-quarters of the total value of fiscally verified invoices, contributed most to the nominal year-on-year growth, which was similar to the previous two weeks. Growth was also underpinned by high nominal turnover growth of 43% in the accommodation and food service activities, which was partly due to the low base.
Electricity consumption by consumption group, December 2022
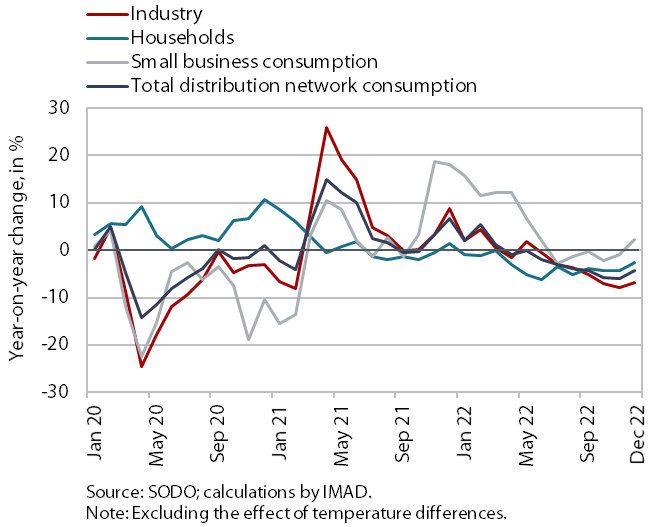
In December 2022, industrial and household consumption in the distribution network were lower year-on-year, while small business consumption was higher. Industrial consumption was 6.8 % lower than in December 2021. According to our estimate, this was due to the lower consumption by some energy-intensive companies, which reduced their production volume under the impact of high electricity prices or improved the energy efficiency of their production processes. Household consumption was also lower than in December 2021 (by 2.6%), mainly due to more rational energy consumption and possibly also because fewer people worked from home. Small business consumption was 2.2 % higher year-on-year in December 2022 due to the absence of COVID-19 containment measures.
Production volume in manufacturing, November 2022
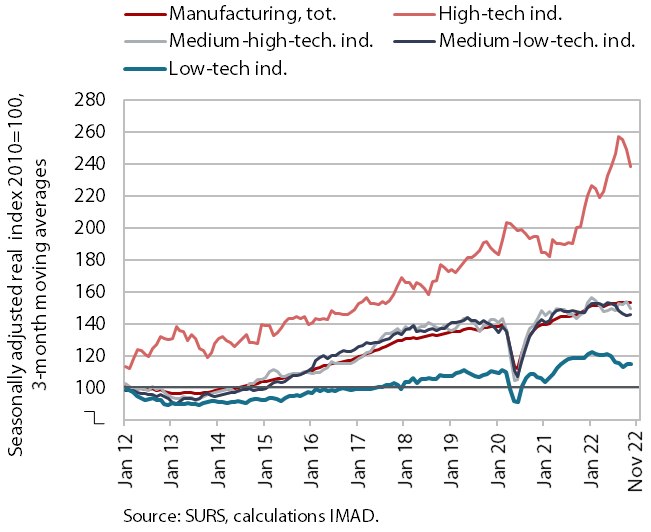
The slow strengthening of manufacturing activity seen in the first three quarters of 2022 came to a halt towards the end of the year. Production in most sectors was also lower year-on-year. After year-on-year growth in the first half of the year, production in low-technology industries (in addition to the more energy-intensive paper industry and, in recent months, also in the wood-processing and furniture industries and the manufacture of food products) was lower year-on-year since the middle of last year. Especially in October and November, medium-low technology industries (with the exception of manufacture of fabricated metal products, which is less energy intensive) and some medium-high technology industries also lagged behind the previous year’s level. In the latter industries, we estimate that this is more related to supply chain disruptions and lower demand (in the manufacture of motor vehicles, manufacture of machinery and equipment n.e.c.) than to energy intensity (which is larger in the chemical industry). In high-technology industries, only production in the manufacture of ICT equipment and, in our estimation, pharmaceutical industry remained higher than a year ago, with output in the first 11 months of 2022 up by one-fifth compared to the same period of 2021. Growth in all other sectors was below 2% on average over the same period.
Activity in construction, October 2022
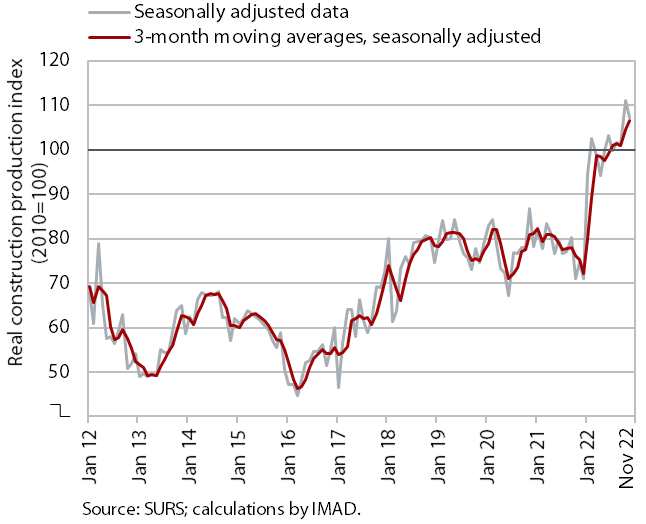
According to figures on the value of construction put in place, construction activity in November was considerably higher than in 2021. The value of construction put in place increased significantly in 2022 and was 44% higher year-on-year in November. Compared to previous years, construction of buildings stands out in terms of the level of activity. Activity was also high in civil engineering, while it was lower in specialised construction work (installation works, building completion). The implicit deflator of the value of construction work put in place (used to measure prices in the construction sector) was 17% in November, which is slightly less than in previous months. However, some other data suggest a significantly lower construction activity. The value of industrial production in two activities traditionally strongly linked to construction does not point to such high growth. Production in other mining and quarrying was 10% higher in November than in the same month of 2021, while it was 9% lower in the manufacture of other non-metallic mineral products.
Current account of the balance of payments, November 2022
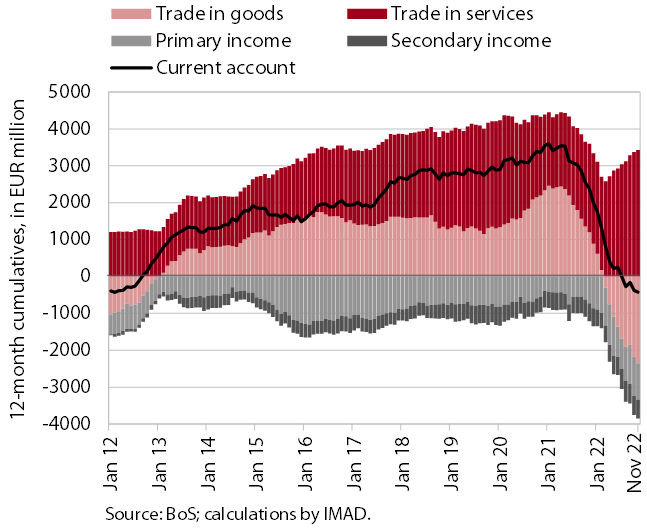
The current account balance of payments in the first 11 months of 2022 recorded a deficit of EUR 217.9 million compared to a surplus of EUR 2.2 billion in the same period of 2021. With imports growing faster than exports, the significant reduction in current account balance was mainly due to goods trade balance, which turned from a surplus to a deficit at the end of 2021. The services surplus increased, especially in trade in travel, as receipts from foreign tourists who visited Slovenia were significantly higher year-on-year (by EUR 1.2 billion) than expenditure of Slovenian tourists abroad (by EUR 0.5 billion). Trade of transport services also contributed to growth of surplus in services trade. Net outflows of primary and secondary income were higher year-on-year. The primary income deficit was higher mainly because more customs duties were paid to the EU budget. In addition, subsidies received from the EU budget were lower. The higher secondary income deficit was arising from higher private sector transfers abroad.
Road and rail freight transport – Q3 2022
The volume of road freight transport decreased significantly also in the third quarter of 2022, while the volume of rail transport remained stable. The volume of road transport performed by Slovenian vehicles decreased significantly quarter-on-quarter for the second quarter in a row and was almost 5% lower than in the same quarter of 2019 (cross-trade by 8% and other road transport by 1%). The sharp quarter-on-quarter decline was related to the decline in the volume of transport performed at least partially on Slovenian territory (exports, imports and national transport combined). The share of cross-trade transport performed by Slovenian vehicles in total transport thus increased markedly (to 47%) and is no longer significantly lower than in the same period before the epidemic (when it was 49%). Rail freight transport, already declining before the epidemic, was about 7% lower than in the same quarter of 2019.