Charts of the Week
Charts of the week from 6 to 10 February 2023: consumer prices, electricity consumption, value of fiscally verified invoices and production volume in manufacturing
Year-on-year consumer price inflation remained at 10% in January, with food and non-alcoholic beverage prices contributing almost one-third to overall inflation. Stronger growth was also seen in food prices. Electricity consumption in January was again lower year-on-year, as it was in the months before. In our estimation, both industrial and household consumption were lower. Amid high price growth, the value of fiscally verified invoices was almost a fifth higher year-on-year in nominal terms at the end of January and the beginning of February, in certain activities mainly due to the low base from last year. Manufacturing output shrank in the fourth quarter of last year and was also slightly down year-on-year.
Consumer prices, January 2023
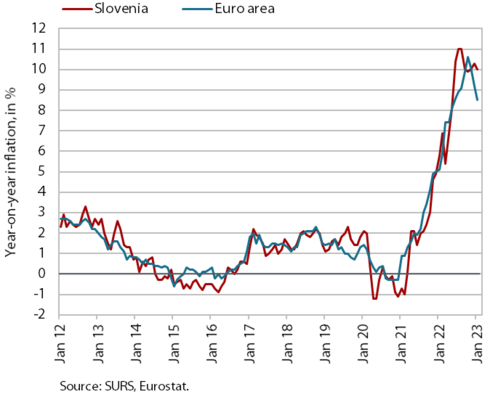
Year-on-year consumer price inflation was still around 10% in January. Stronger growth was recorded for prices of food, which we believe was also due to new contracts between traders and producers who have passed on the previous year’s higher costs to end-users to an even greater extent. Data on energy and input price developments indicate that cost pressures related to raw materials in this segment have eased in recent months. Prices in the food and non-alcoholic beverages group were thus 19.3% higher year-on-year in January, contributing almost one-third to overall inflation. Stronger growth was recorded also for prices of services, mainly due to higher prices in the groups recreation and culture and restaurants and hotels. Prices of semi-durable goods also rose, reflecting somewhat less pronounced seasonal declines in the group clothing and footwear. However, despite monthly price increases for new motor cars (2%) and furniture and furnishings (2.1%), price increases for durable goods (7.9%) continue to slow gradually.
Electricity consumption, January 2023
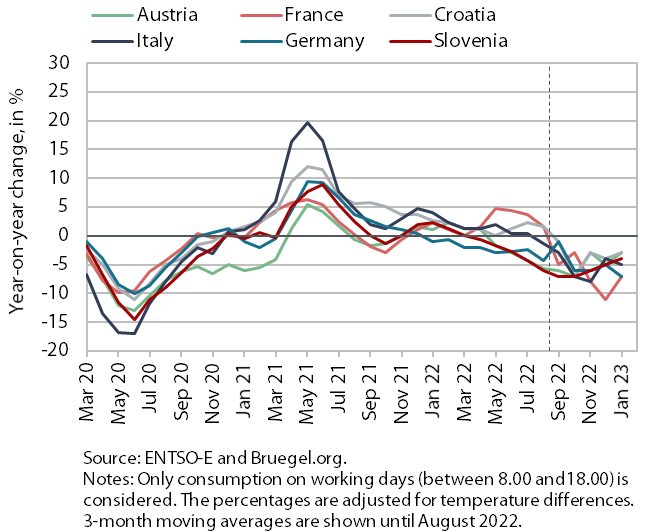
Electricity consumption was 4% lower year-on-year in January. In our estimation, both industrial and household consumption were lower. According to our estimates, industrial consumption was lower mainly due to lower consumption by some energy-intensive companies, which reduced their production volume due to the high electricity prices, but probably also improved their energy efficiency by upgrading their manufacturing technologies. Household consumption was lower year-on-year most likely due to fewer people working from home and more rational consumption of energy. Slovenia’s main trading partners also recorded a year-on-year decline in consumption (Austria and Croatia by -3%, Italy by -5%, and France and Germany by -7%).
Value of fiscally verified invoices, in nominal terms, 22 January–4 February 2023
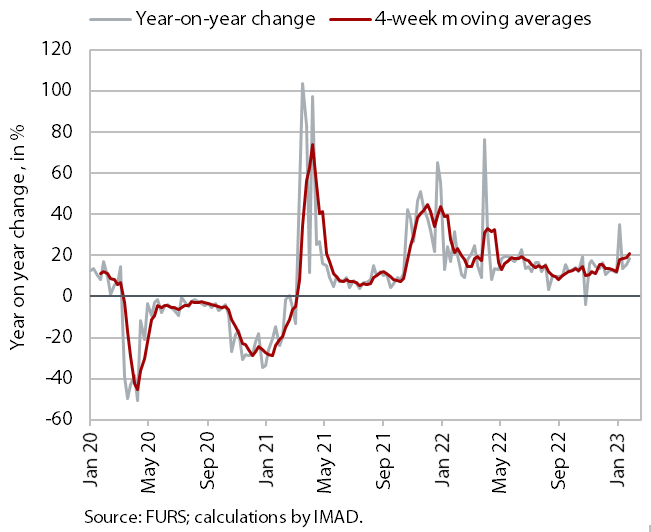
Amid high price growth, the nominal value of fiscally verified invoices between 22 January and 4 February 2023 was 17% higher year-on-year. In trade (17% year-on-year growth), growth in the sale of motor vehicles strengthened significantly (to 34%), while growth in retail trade slowed to a similar level to late last year (just over 10%). Nominal turnover growth also remained high in accommodation and food service activities (40%), certain creative, arts and entertainment activities, sports activities, and gambling and betting activities (overall growth in other service activities (RST services) was 50%). This is due to last year’s low base and also to this year’s different timing of the winter break.
Production volume in manufacturing, December 2022
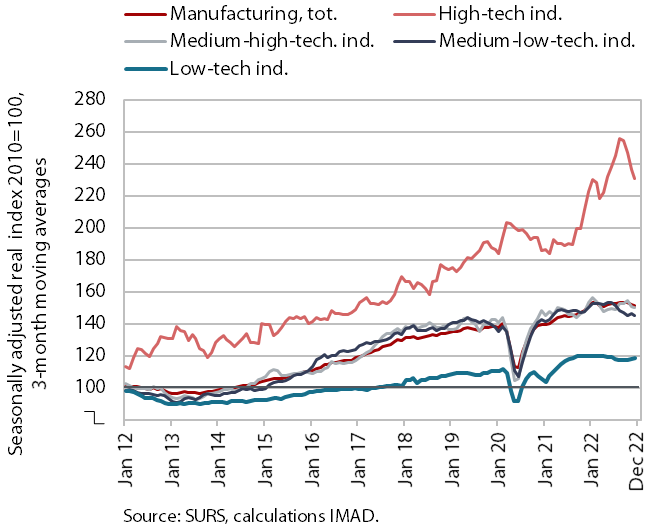
After modest growth in the previous quarters, manufacturing output contracted in the fourth quarter of last year and was also down slightly year-on-year. The year-on-year decline in the more energy-intensive industries mostly deepened. Only the chemical industry and the manufacture of other non-metallic mineral products recorded a slight increase in production last year compared to 2021. Output in certain industries producing investment goods (manufacture of motor vehicles, repair and installation of machinery and equipment, and, after modest growth in the first three quarters of last year, manufacture of machinery and equipment n.e.c.) was still lower year-on-year in the fourth quarter of last year, which we estimate to be related to supply chain disruptions and a cooling of demand. Growth in high-technology industries (mainly pharmaceutical industry, in our estimation) also slowed sharply in the fourth quarter, contributing most to the 4.1% growth in manufacturing output for the year as a whole.