Charts of the Week
Charts of the week from 25 to 29 August 2025: consumer prices, economic sentiment, turnover in trade, turnover in market services and other charts
Year-on-year inflation rose slightly again in August (3.0%), driven mainly by higher prices in the clothing and footwear group. The largest contribution to inflation continued to come from food and non-alcoholic beverages group (7.6%), where price growth, after strengthening in previous months, edged down marginally in August. Economic sentiment improved slightly further in August, but it remained weaker than a year earlier and also somewhat below the long-term average. Turnover in most trade sectors strengthened in the second quarter (seasonally adjusted). In the first half of the year, turnover in all trade sectors was also higher year-on-year. Total real turnover in market services declined in the second quarter (seasonally adjusted) and remained lower year-on-year. In the first half of the year, it was higher year-on-year only in transportation and storage and in professional and technical activities. According to survey data, unemployment decreased year-on-year in the second quarter, and the number of persons in employment also declined, primarily due to a decline in other forms of work.
Consumer prices, August 2025
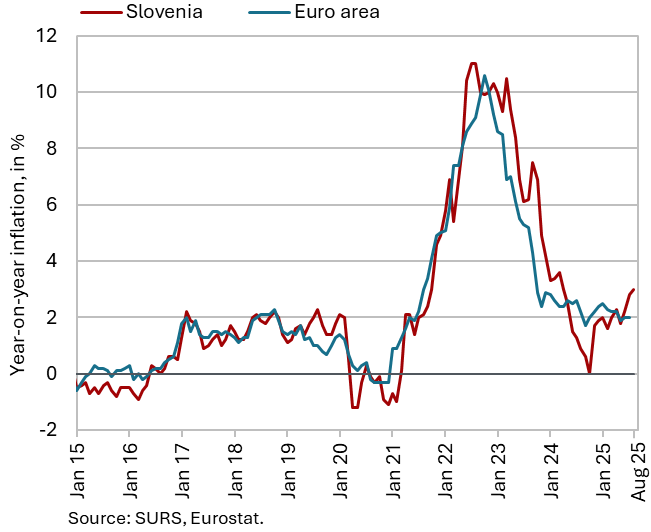
Year-on-year growth in consumer prices (3.0%) strengthened slightly again in August, while prices remained unchanged month-on-month. Prices in the clothing and footwear group declined by 2.4% month-on-month (seasonally), marking the smallest August decrease in the past five years. Given the relatively low base due to last year’s above-average monthly fall (–7.7%), year-on-year price growth in this group rose from 1.1% in July to 6.9% in August. This also contributed to higher year-on-year growth in semi-durable goods prices (5.2%), while the growth of durable goods prices remained subdued (0.3%). Year-on-year price growth in food and non-alcoholic beverages group, which had been strengthening in previous months, declined marginally in August. However, at 7.6%, it was still the highest among all groups of goods and services and contributed 1.4 p.p. to year-on-year inflation. Year-on-year growth in services prices remained around 3%.
Economic sentiment, August 2025
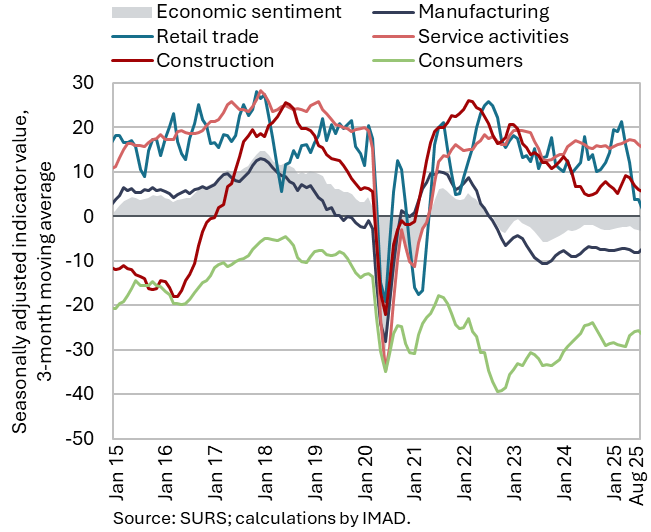
Economic sentiment continued to improve in August, but it was still weaker than a year earlier. The value of the economic climate indicator, which increased for the second consecutive month, remained lower compared with the same month last year. The monthly improvement in August was driven by higher confidence indicators in manufacturing and services (both also higher year-on-year) and by an improvement in the consumer confidence indicator, but remained lower year-on-year for the third consecutive month. In August, the values of confidence indicators in construction and retail trade were also lower year-on-year. Economic sentiment remained slightly below the long-term average.
Turnover in trade, June 2025
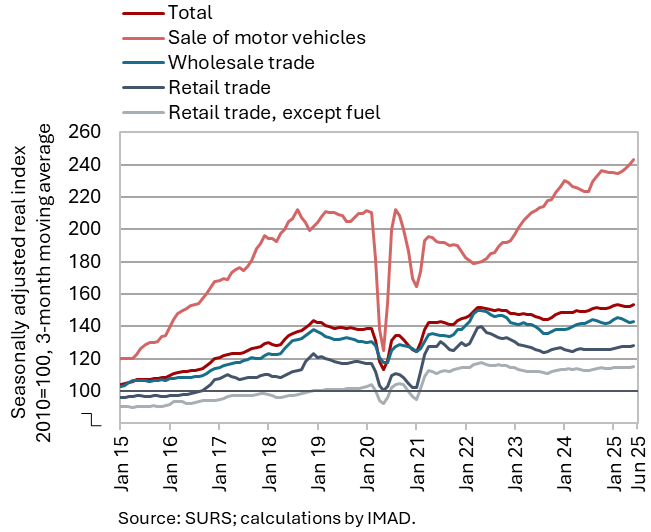
Real turnover in all trade sectors was higher year-on-year in the second quarter and in the first half of the year as a whole. Turnover in retail trade with food products increased in the second quarter after a decline in the first. It rose markedly in motor vehicle trade after stagnating in the first quarter, while growth also continued in retail trade with non-food products. Following a sharp decline in March, wholesale turnover increased in the next three months, though on average in the second quarter it was lower than in the first (all seasonally adjusted). Sales in all trade sectors were also higher year-on-year in the second quarter and in the first six months overall; growth was strongest in motor vehicle trade (6%), while in other trade sectors it was much more modest (around 2% on average).
Turnover in market services, June 2025
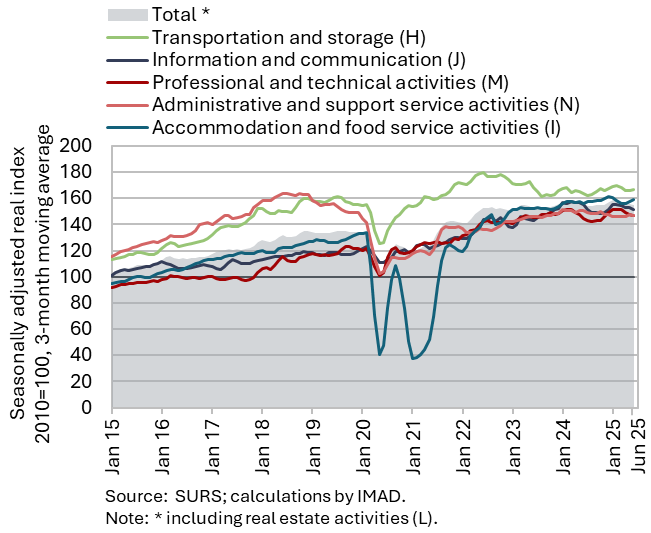
Total real turnover in market services declined in the second quarter (seasonally adjusted) and remained lower year-on-year (by 0.4%). After stagnation in the first quarter, turnover fell by 1.3% in current terms in the second quarter. After two quarters of growth, the sharpest decline was recorded in professional and technical activities, mainly as a result of a more pronounced contraction in the two main activities in terms of turnover (architectural and engineering services, and consulting services). Following strong growth in the first quarter, turnover also declined significantly in information and communication, this time mainly due to a sharp fall in sales of computer services in the domestic market. After three quarters of moderate growth, turnover in transportation and storage fell slightly, particularly in storage and air transport. Meanwhile, accommodation and food service turnover strengthened in the second quarter, after a decline in the first, largely on account of strong growth in overnight stays by foreign tourists. Turnover also rose slightly in administrative and support service activities, after having declined since the second quarter of last year. This coincided with a contraction in employment services turnover, although this time the negative trend was halted. In the first half of 2025, real turnover increased year-on-year only in transportation and storage and in professional and technical activities.
Active and inactive population, Q2 2025
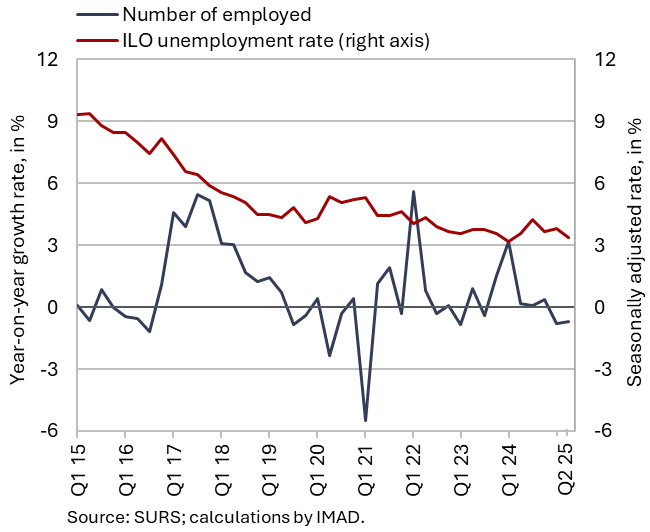
According to the survey data, the number of unemployed persons in the second quarter was lower year-on-year, as was the number of persons in employment. Both developments were mainly the result of transitions into inactivity (e.g. retirement or education). According to survey data, 35 thousand persons were unemployed, which is 5.7% less than in the second quarter of last year. The survey unemployment rate (3.2%) was 0.2 p.p. lower year-on-year, reaching a record low. The number of persons in employment was slightly lower year-on-year in the second quarter (–0.7%). The number of employees in labour relation and the self-employed remained largely unchanged year-on-year, while the number of persons in other forms of work (contract work, student work, cash-in-hand work, apprenticeship) declined.