Charts of the Week
Charts of the week from 17 July to 18 August 2023: gross domestic product, consumer prices, slovenian industrial producer prices, trade in goods and other charts
In the second quarter, GDP increased by 1.4% quarter-on-quarter (seasonally adjusted) and by the same amount year-on-year. Construction activity and value added growth in manufacturing picked up, while manufacturing output contracted. Inventories fell sharply, which, in addition to lower household consumption, contributed to the sharp decline in imports. As the decline in exports was much smaller, the contribution of external trade was strongly positive and the current account of the balance of payments recorded a large surplus (EUR 1.4 billion), also given the improved terms of trade. The growth of consumer prices and also of Slovenian industrial producer prices is slowing. Lower energy prices contributed most to the decline in inflation in July, while the growth of food prices is also slowing, though it is still relatively high at 10.7%. Year-on-year growth of industrial producer prices, which was still close to 20% at the end of last year, was 4.9% in June this year, partly due to the base effect. The average wage was higher year-on-year in real terms in May, mainly due to the increase in public sector wages following last year’s wage increase agreement. The number of persons in employment rose again in June. For some time now, employment has been increasing almost exclusively through the employment of foreigners. Unemployment remains low and was 13% lower year-on-year in July. Given the severe labour shortage, long-term unemployment and unemployment among older people have also declined. The economic sentiment indicator also deteriorated in July, mainly due to lower confidence in retail trade and also in services and manufacturing.
Gross domestic product, Q2 2023
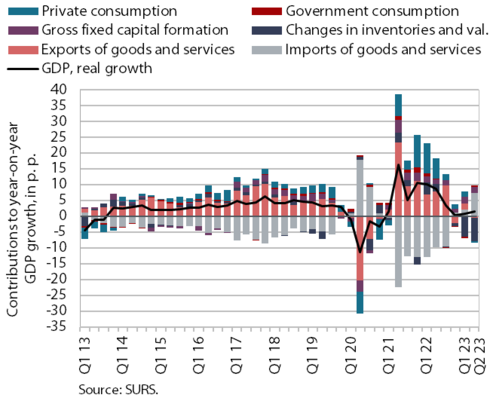
In the second quarter of 2023, real gross domestic product (GDP) increased by 1.4% quarter-on-quarter (seasonally adjusted) and by the same amount also year-on-year. Construction activity and value added growth in manufacturing have picked up, which is not what is evident from the monthly data available on industrial production in manufacturing. Growth in the services sector has declined. Gross fixed capital formation, especially in construction, also increased significantly and government consumption picked up. Inventories fell sharply (their contribution was -7.3 p.p.), which, along with lower household consumption, contributed to the sharp decline in imports. The latter was more pronounced than the decline in exports, which led to a very high positive contribution of external trade to GDP growth (6.7 p.p.).
Consumer prices, July 2023
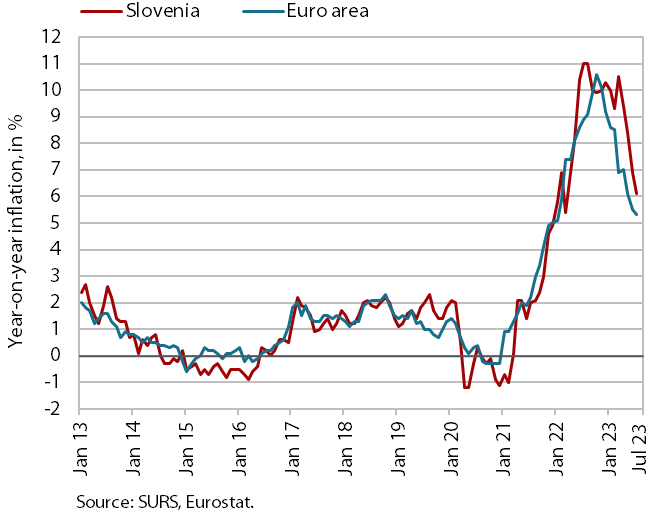
Year-on-year consumer price growth slowed further in July. The main reason for the slower growth were the 8.3% lower energy prices. Food price growth slowed further, and although still relatively high at 10.7%, food prices fell month-on-month for the second month in a row. This was mainly due to seasonally lower prices of fruit and vegetables, while prices of dairy products and bread and cereal products also fell slightly. The slowdown in the year-on-year growth of furniture prices (7.4%) and the slight decline in car prices continue to be accompanied by a gradual slowdown in the increase in durable goods prices (2.2%). However, growth of semi-durable goods prices (6.5%) accelerated slightly, reflecting less pronounced seasonal price drop in the clothing and footwear group. The broad-based year-on-year growth in service prices remains slightly below 8.5%. Services related to recreation and culture, which account for about two-fifths of all services and whose prices have risen by about 9% year-on-year, have contributed the most to inflation (slightly more than 1 p.p.). The highest price increase (by about one-tenth) was recorded in transport-related services. Prices of air tickets increased by almost 40% and prices of car insurance by almost 17%. Among the 12 groups of goods and services, the strongest price growth continues to be seen in the health group, where the price increase in July was still almost 14% year-on-year.
Slovenian industrial producer prices, June 2023
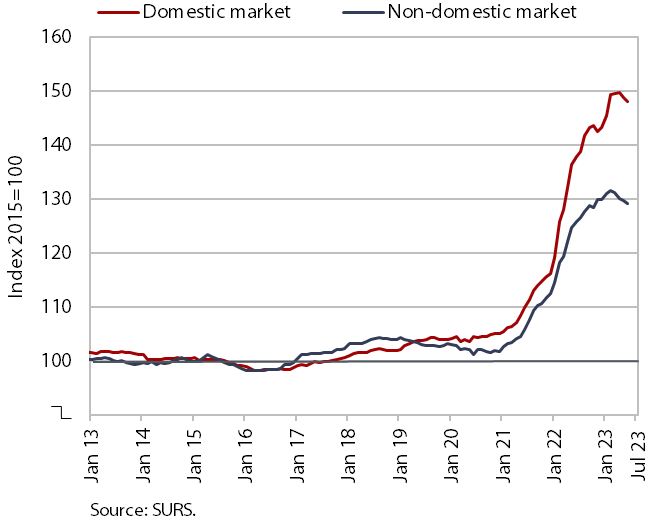
Slovenian industrial producer prices fell month-on-month in the second quarter. The price cuts are gradually affecting more and more segments. In June, prices fell by 0.5%. Prices of intermediate goods (-1%), capital goods (-0.1%) and, for the first time since May 2021, consumer goods (by 0.3% for both durable and non-durable goods) fell. After reaching almost 20% at the end of last year, year-on-year price growth slowed further to 4.9% in June. In addition to the slowdown in monthly price growth, the base effect remains a major contributor to the lower growth. Due to strong growth in the second half of last year and at the beginning of this year, energy prices still recorded the strongest year-on-year increase (by slightly more than one-fifth in June). The slowdown in price growth for consumer goods (7.9%) has intensified somewhat in recent months, and price increases for intermediate goods (1.3%) and capital goods (4.5%) have also weakened further.
Trade in goods – in real terms, June 2023
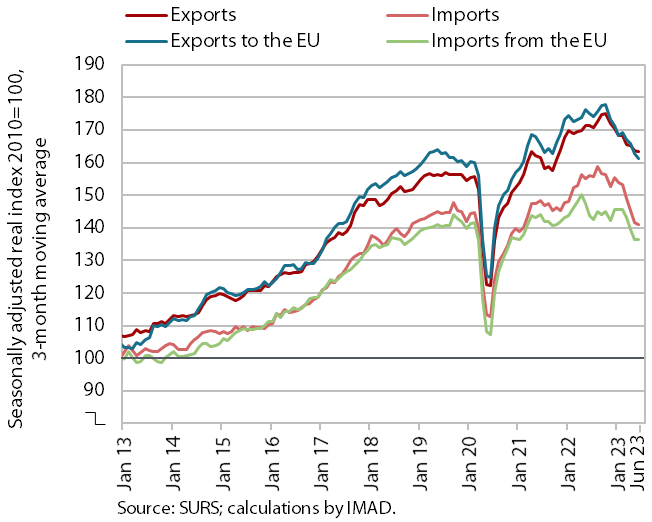
In the second quarter, trade in goods slowed compared to the first quarter. This is related to a decline in demand from Slovenia’s main trading partners and lower consumption in Slovenia. Real exports of goods fell by 1.2% and imports by 5.3%. Exports and imports of intermediate and consumer goods decreased. Lower trade with EU Member States, especially Italy and Austria (seasonally adjusted), contributed significantly to this decline. The decline in exports and imports in the second quarter was even more pronounced year-on-year (-5.5% and -10.5% respectively). At the beginning of the third quarter, sentiment in export-oriented manufacturing activities remained very low in Slovenia. Also in the third quarter, companies indicate that the main limiting factors to business operations are related to the uncertain economic situation, low domestic and foreign demand and the lack of skilled labour.
Current account of the balance of payments, June 2023
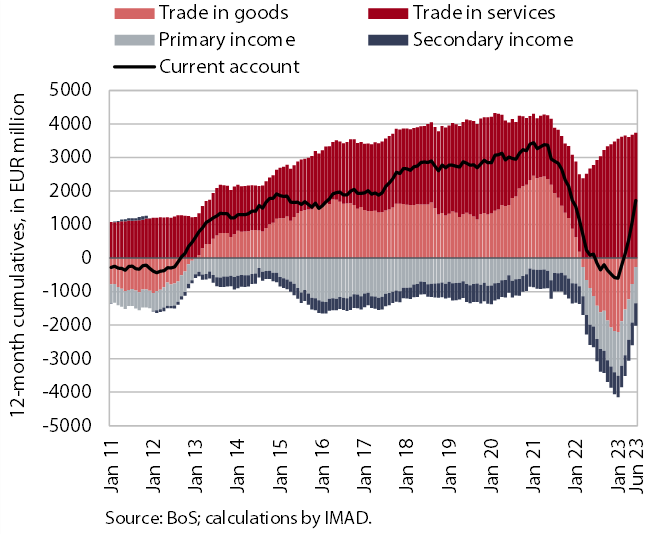
The surplus on the current account of the balance of payments was high in the second quarter of this year (EUR 1.4 billion). The largest contribution to the improvement of the current account balance came from the goods trade balance, which turned from a deficit to a surplus. While goods exports declined only slightly year-on-year in the second quarter, the decline in imports was much larger and the terms of trade improved. We estimate that the quantity fluctuations contributed EUR 1 billion to the year-on-year change in the balance of goods trade in the second quarter (EUR 1.3 billion) and the terms of trade contributed EUR 0.3 billion. The growth of the services surplus continued, especially in trade in transport services. The decline in imports of transport services was much larger than the decline in exports, which is related to the development of trade in goods. The primary income deficit was also lower year-on-year in the second quarter. This was mainly due to lower net outflows of dividends and profits and higher net interest receipts by the government and the Bank of Slovenia from deposits in foreign accounts. The higher secondary income deficit arose from higher government and private sector transfers abroad. The 12-month current account balance showed a surplus of EUR 1.7 billion in June (2.7% of estimated GDP for 2023).
Activity in construction, June 2023
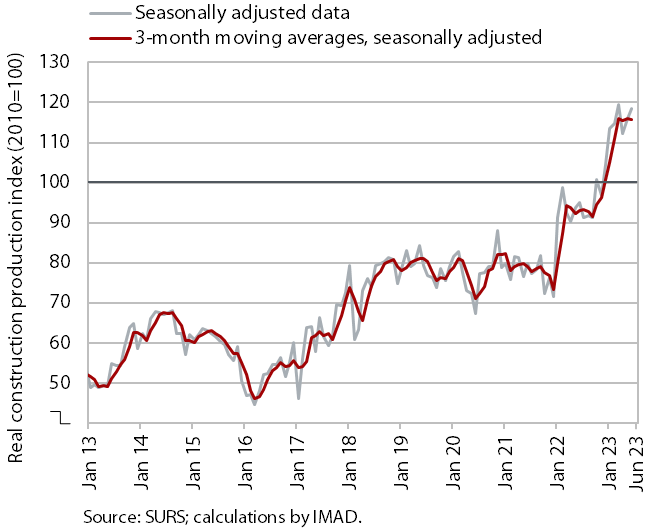
According to data on the value of construction work put in place, construction activity in the second quarter was again significantly higher than last year. After recording high growth at the beginning of the year, the value of construction work put in place remained roughly unchanged in the second quarter. Compared to the second quarter of last year, it was 24% higher. As regards specialised construction activities, it went up by 49%, as regards civil engineering by 21% and as regards building construction by 12%.
However, some other data suggest significantly lower year-on-year growth in construction activity. According to VAT data, the activity of construction companies in the second quarter was 12% higher than the same period last year. Data on the value of industrial production in two activities traditionally strongly linked to construction also do not point to such high growth. Production in other mining and quarrying was 12% lower in the second quarter than in the same quarter of 2022, while it was 13% lower in the manufacture of other non-metallic mineral products.
Production volume in manufacturing, June 2023
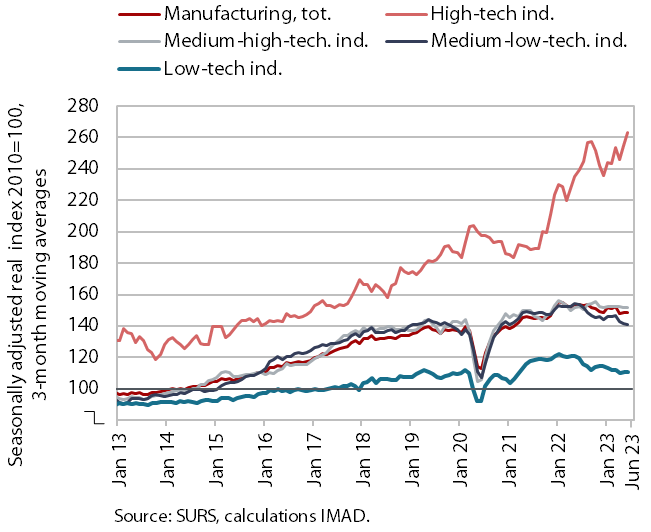
Manufacturing output recovered in May and June, but remained lower in the second quarter than in the first (down 2.3% seasonally adjusted) due to a sharp decline in April. Only output in high-technology industries increased, surpassing the level of the same period last year also in the second quarter. Output in medium-high-technology industries remained higher than a year ago, with the exception of the energy-intensive chemical industry. In the latter, as in other energy-intensive industries, the year-on-year decline intensified. In most other low- and medium-technology industries, the year-on-year decline was also stronger than in the first quarter.
The outlook for manufacturing remains weak. According to data on business trends, in July, most companies surveyed expected exports to decline in the coming three months.
Turnover in trade, May–June 2023
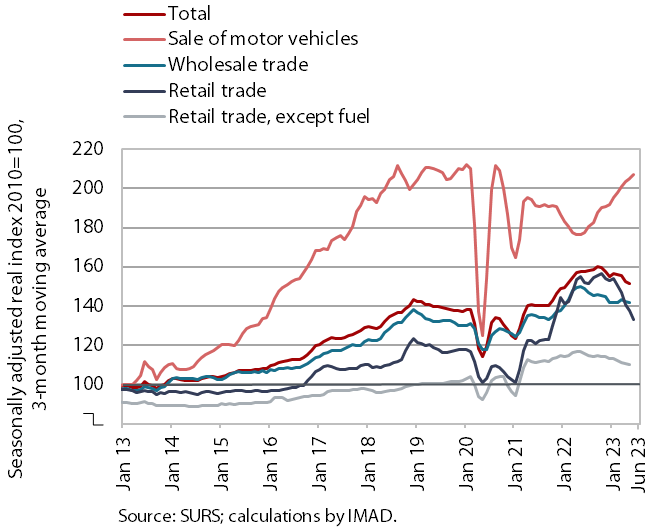
In most trade sectors, real income continued to fall in May and, according to preliminary data, also in June; only in the sale of motor vehicles it remained higher year-on-year. Turnover in the sale of motor vehicles, which has been rising in current terms since the second half of last year, was up by 10% year-on-year in May. In the other two sectors, namely wholesale and retail trade (excluding automotive fuel), turnover was about 5% lower year-on-year in May. Turnover in retail sale of food, beverages and tobacco fell by 3%, while in the sale of non-food products it fell by 7%. Among non-food products, the largest year-on-year decline was seen in the sale of durable and certain semi-durable goods, as has been the case all year. According to preliminary SURS data, turnover in June was still lower year-on-year in retail trade and higher in the sale of motor vehicles.
Value of fiscally verified invoices – in nominal terms, 23 July–5 August 2023
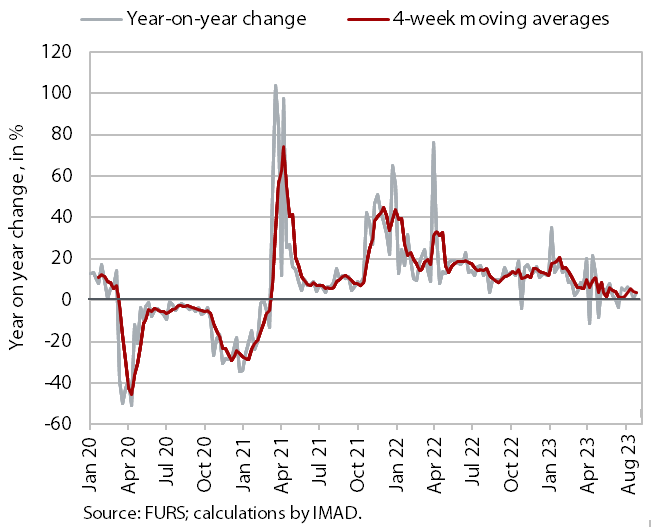
The nominal value of fiscally verified invoices between 23 July and 5 August 2023 was 2% higher year-on-year. The slightly lower growth than in the previous two 14-day periods is also due to lower sales as a result of the floods that hit Slovenia in the beginning of August. The 3% year-on-year growth of turnover in trade was mainly due to the sale of motor vehicles (20%) and wholesale trade (2%), while retail trade was slightly lower than last year. Turnover growth in accommodation and food service activities also halved (to 7%) after rising in the previous 14-day period (following weaker results in the second half of June due to high sales last year before the expiry of the deadline for the redemption of tourism vouchers).
Turnover in market services, May 2023
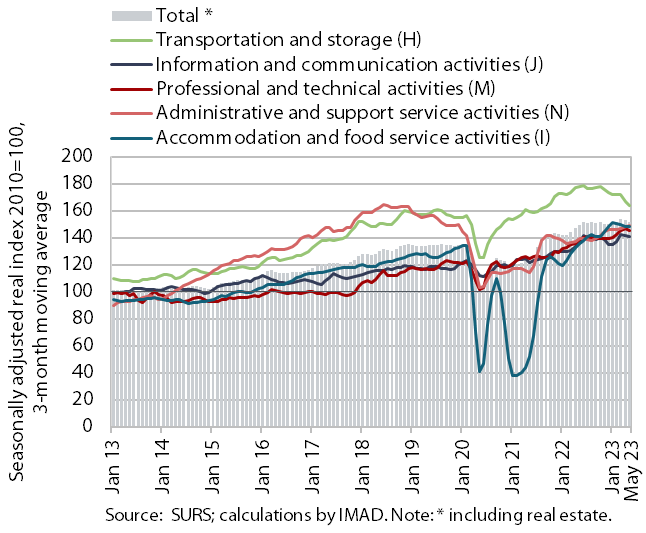
Real turnover in market services fell further slightly in May. After growing in the first quarter, turnover declined at the beginning of the second quarter; in May it fell by 0.3% in current terms compared to April. The decline in turnover continued in professional and technical activities, with a significant drop in architectural and engineering services for the second month in a row. The decline in information and communication activities was much smaller as turnover in computer services declined in the domestic market, while it increased in foreign markets. Turnover in other market services rose, most markedly in transportation and storage, where it had been declining since May last year. After three months of contraction, it also rose in accommodation and food service activities. Moderate turnover growth continued in administrative and support service activities with further growth in employment services. Year-on-year, total turnover fell by 0.1% in real terms in May due to lower activity in transportation and storage. It remained below pre-epidemic (May 2019) levels in administrative and support service activities (by 5%), the most in employment services (by 25%).
Economic sentiment, July 2023
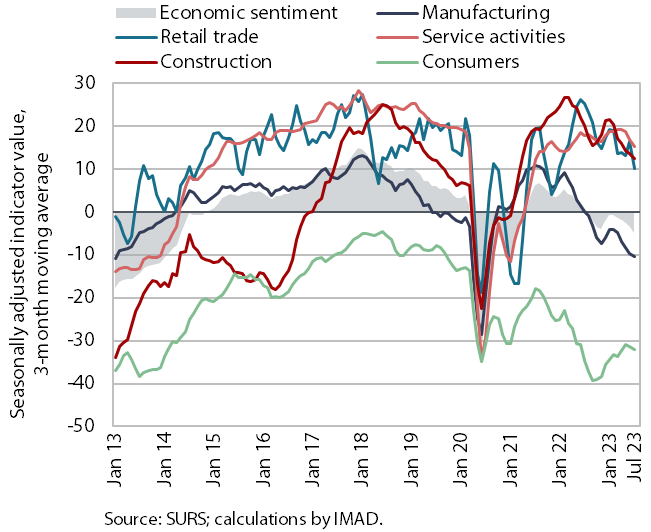
The negative trend of the sentiment indicator continued in June. Sentiment fell by 1.6 p.p. month-on-month (according to seasonally adjusted data). This was mainly due to lower confidence in retail trade, services and manufacturing. The sharpest decline in confidence at the monthly level was recorded in retail trade (where it fell by 16 p.p. to 0, where the indicator last stood in October 2021). Retailers’ assessments of sales and inventories were significantly weaker than in previous months. Compared to last July, the value of the sentiment indicator was lower by 5.7 p.p. (according to original data). Confidence fell most sharply in retail trade and manufacturing, but also slightly in services and construction. It was higher among consumers, who were more optimistic about the future financial situation of their households and the economic situation of the country than a year ago.
Number of persons in employment, June 2023
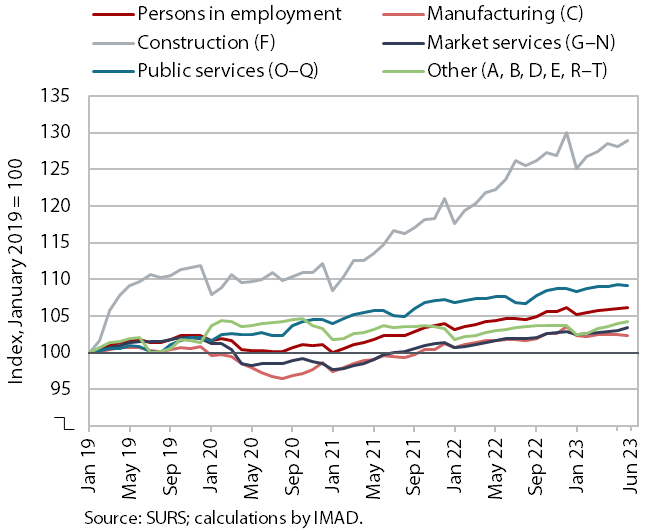
In June, the number of persons in employment further increased but the year-on-year growth was slightly lower than in previous months (1.4%). This was mainly due to the year-on-year decrease in the number of civil servants. The strongest year-on-year growth was still seen in construction, which is facing a major labour shortage and saw the largest increase in the number of persons in employment also compared to early 2019. Employment of foreign workers has been the largest contributor to the overall growth in the number of persons in employment for some time now – their contribution was 92.3% year-on-year in June, slightly higher than in previous months. Foreigners accounted for 14.5% of total employment in June, up 1.2 p.p. year-on-year. The sectors with the highest share of foreigners were construction (48%), transportation and storage (33%), and administrative and support service activities (27%).
Number of registered unemployed persons, July 2023
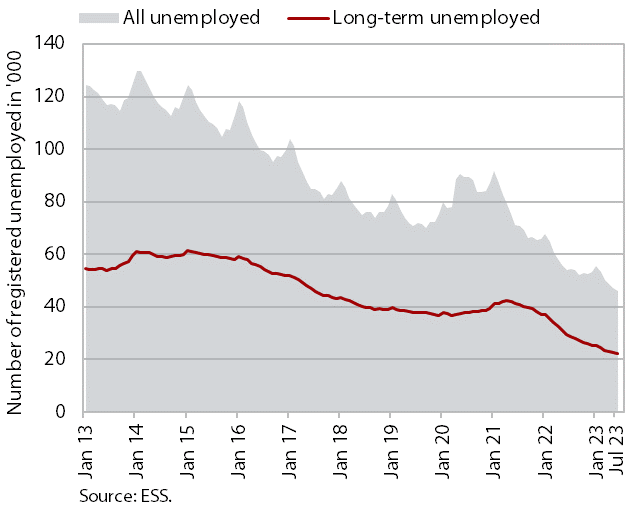
According to the seasonally adjusted data, the monthly decline in the number of registered unemployed was lower in July (-0.3%) compared to the previous months. According to original data, 47,287 people were unemployed at the end of July, 2.4% more than at the end of June. This largely reflects seasonal trends related to a higher inflow into unemployment due to expiry of fixed-term employment contracts. Unemployment was down 13% year-on-year. Amid severe labour shortages, the number of long-term unemployed fell by 23.1% year-on-year at the end of July and the number of unemployed people over 50 by 12.8%.
Average gross wage per employee, May 2023
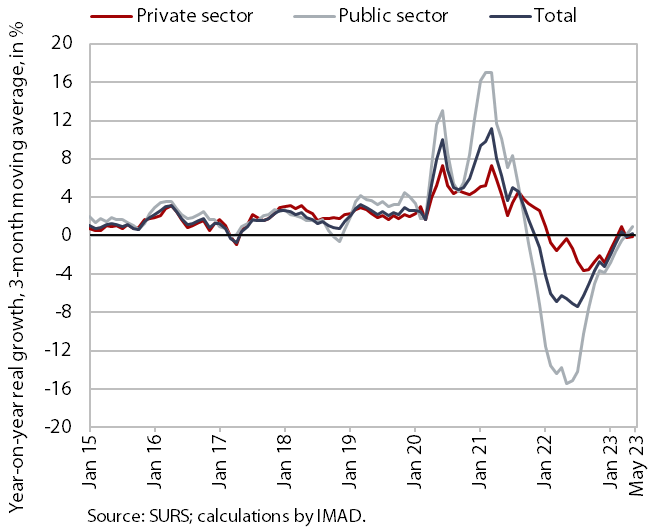
The average gross wage increased by 2.4% year-on-year in real terms in May. In the private sector, the average gross wage increased by 2.1% year-on-year in real terms. Growth was strongest in administrative and support service activities, which face severe labour shortages. In the public sector, the average gross wage increased by 2.9% year-on-year in real terms, mainly due to the last year’s wage increase agreement. Compared to May last year, the average gross wage increased by 11% in nominal terms – by 11.6% in the public sector and by 10.7% in the private sector. In the first five months, the average year-on-year gross wage growth was modest in real terms – 0.7% (0.7% in the private sector and 0.6% in the public sector).
Electricity consumption, July 2023
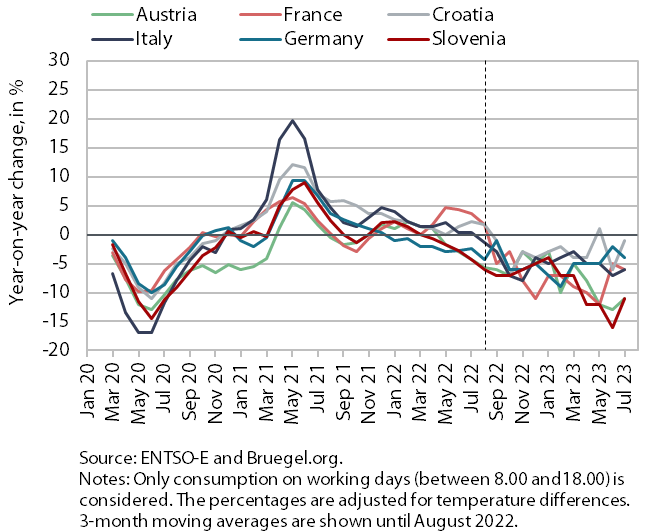
Electricity consumption was 11% lower year-on-year in July. This was mainly due to lower industrial consumption, in our estimation especially in the energy-intensive part of industry. Household consumption may also have contributed to lower year-on-year consumption as a result of more rational utilisation of energy and storm-related power outages. Slovenia’s main trading partners also recorded a year-on-year decline in consumption in July (Austria by 11%, Italy and France by 6%, Germany by 4% and Croatia by 1%).
Electricity consumption by consumption group, July 2023
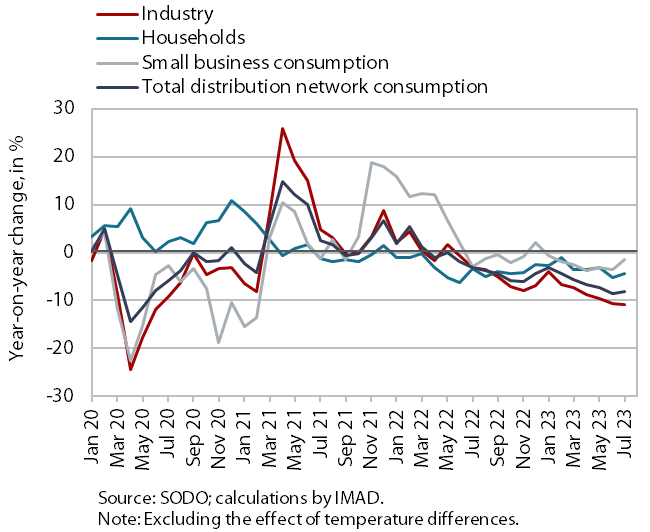
In July, electricity consumption in the distribution network was lower year-on-year in all consumption groups. As in previous few months, the sharpest year-on-year decline was seen in industrial consumption (by 10.8%). Household consumption was also lower year-on-year in July (by 4.3%), according to our estimates mainly due to a more rational energy consumption and storm-related power outages. Small business consumption was 1.5% lower year-on-year in July.