Charts of the Week
Charts of the week from 10 to 14 November 2025: gross domestic product, electricity consumption by consumption group, manufacturing production and other charts
Economic activity continued to strengthen in the third quarter (by 0.8% quarter-on-quarter, seasonally adjusted). Year-on-year growth reached 1.7%, while activity in the first nine months increased by 0.7%. In the third quarter, growth in construction investment accelerated markedly, while private consumption growth moderated somewhat but remained an important driver of this year’s economic expansion. Goods exports and manufacturing activity picked up following contractions in the first half of the year. Nevertheless, in the first nine months, both indicators remained below their levels from the same period last year, with the sharpest declines recorded in the manufacture of motor vehicles and other transport equipment, as well as in metal industry. The current account surplus narrowed year-on-year in the third quarter, primarily due to a decline in the goods trade balance.
Gross domestic product, Q3 2025

Economic growth continued in the third quarter of this year. GDP rose by 0.8% quarter-on-quarter (seasonally adjusted) and by 1.7% year-on-year. Year-on-year growth in private consumption eased slightly (1%), yet it remained an important driver of this year’s growth. Gross fixed capital formation increased markedly year-on-year (9.1%) after contracting in the first half of the year. Investment in infrastructure and non-residential buildings increased substantially, while investment in residential buildings remained lower than a year ago. Following a decline in the previous quarter, general government consumption rose by 1.2% year-on-year, primarily due to the fading impact of last year’s elevated base associated with post-flood reconstruction expenditures. With exports declining year-on-year (–1.1%) and imports rising (0.7%), external trade balance made a negative contribution to GDP growth (–1.4 p.p). The contribution of inventories, which had been revised sharply downward for the first half of the year, turned positive in the third quarter (0.6 p.p.). In the first nine months, GDP was up 0.7% year-on-year.
Electricity consumption by consumption group, October 2025
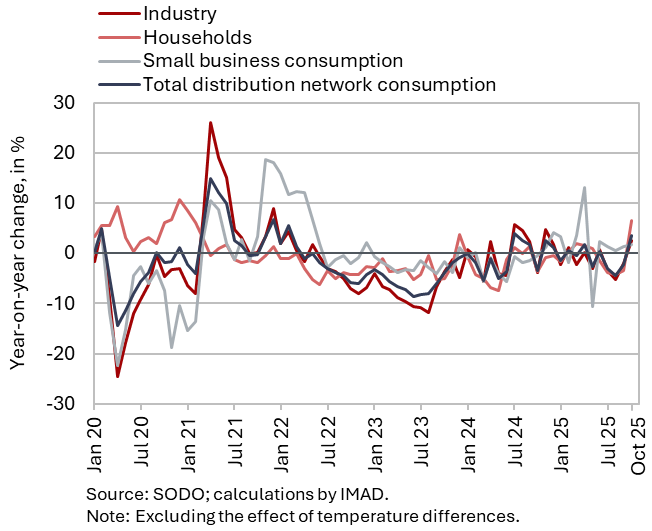
Electricity consumption in the distribution network was 3.6% higher year-on-year in October. With the same number of working days, industrial consumption, which can serve as an indicator of economic activity, was 1.7% lower month-on-month, while it was 2.5% higher year-on-year. Household consumption and small business consumption were higher year-on-year (by 6.5 and 1.8% respectively).
Manufacturing production, September 2025
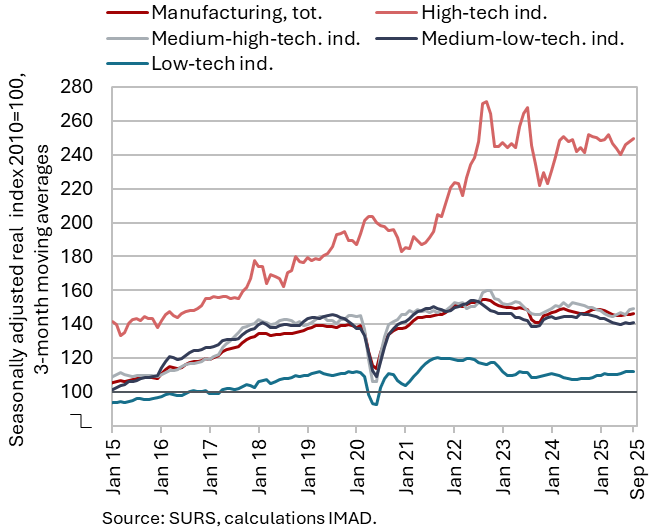
After contracting in the first half of the year, manufacturing output increased slightly in the third quarter (seasonally adjusted), and after declining in the first half of the year, it remained largely unchanged year-on-year. In the third quarter, output increased across all groups of industries by technological intensity (seasonally adjusted). Year-on-year, output in high-technology and low-technology industries remained higher, and in the first nine months it also exceeded the levels recorded a year earlier. However, output in medium-high-technology and medium-low-technology industries remained lower year-on-year in the third quarter as well; in the first nine months, it declined by an average of around 2.5% year-on-year. Output in the manufacture of motor vehicles and other transport equipment was one tenth lower than in the first nine months of last year, while it fell by around 5% in the metal industry. Only in the chemical and rubber industries and in the repair and installation of machinery and equipment was the production slightly higher year-on-year. Manufacturing output in the first nine months was, on average, 1.0% lower than a year earlier (working-day adjusted).
Activity in construction, September 2025
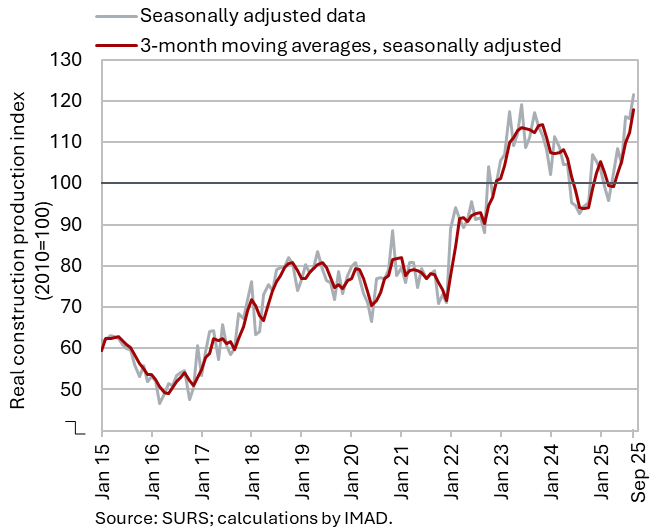
In September, the value of construction works continued to strengthen markedly. Following a decline in the first quarter, construction activity strengthened over the remainder of the year: in the second quarter by 6%, and in the third by as much as 12% (all seasonally adjusted). In the first nine months of the year, the total value of construction put in place was 7% higher than in the same period last year. The largest increase was recorded in the construction of non-residential buildings and specialised construction activities (12%). Activity was also higher in civil engineering (2%), while it was lower in the construction of residential buildings (–2%).
The confidence indicator in construction fell slightly in October, but remains significantly above its long-term average. Companies generally assess new orders as normal. The most important constraint continues to be a shortage of skilled workers, while insufficient demand is cited as a limiting factor by only about one tenth of firms. This indicates that the current challenges in construction are primarily driven by supply-side rather than demand-side constraints.
Current account of the balance of payments, September 2025
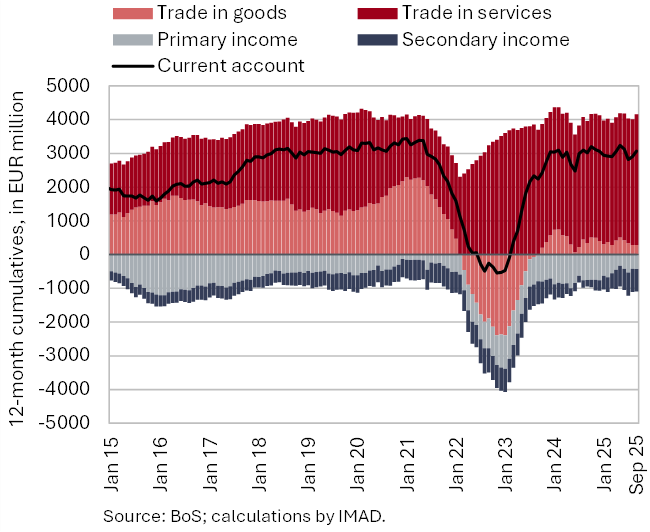
The current account surplus declined year-on-year in the third quarter. This was mainly due to lower goods trade balance. Real exports of goods fell relative to the same period last year, while goods imports increased. The terms of trade improved again. It is estimated that quantity fluctuations contributed EUR 256 million to the year-on-year change in the balance of goods trade in the third quarter (EUR 141 million), while the effect of terms of trade was positive (EUR 115 million). The services surplus increased year-on-year, mainly due to a larger surplus in insurance, travel and transport services. The primary income deficit widened year-on-year mostly due to higher net outflows of dividends and profits from direct investments. The higher secondary income deficit resulted from lower transfers from the EU budget to the government sector. On an annual basis, the current account surplus remained high, with the 12-month current account balance showing a surplus of EUR 3.1 billion in September (4.4% of estimated GDP for 2025).