
Slovenian Economic Mirror
Slovenian Economic Mirror 3/2026
In Slovenia, the war in the Middle East had not yet had a more visible impact on economic activity in the first quarter of this year, and economic growth strengthened (by 0.7% quarter-on-quarter and 3.0% year-on-year). Growth exceeded expectations, driven primarily by stronger export activity. Private consumption growth remained moderate, with households increasing purchases mainly of cars, non-food products, and tourism-related services both domestically and abroad. Investment growth also continued, particularly in construction, while growth in government consumption strengthened somewhat, mainly due to higher expenditure on long-term care, increased employment – especially in health and social care – and higher spending on goods and services. While sentiment indicators in the euro area had already begun to deteriorate in March owing to the war in the Middle East, confidence in Slovenia declined in April, most notably among consumers. As a result, the economic sentiment indicator fell to its lowest level since the second half of 2023. The war also affected inflation, which rose to 3.1% year-on-year in April due to higher fuel prices. Labour market conditions remained stable. The number of persons in employment remained almost unchanged in March, while the number of unemployed persons declined slightly in April. This issue also includes two selected topics: business performance of companies in Slovenia in 2025 and life satisfaction in Slovenia, which, according to the Eurobarometer survey, reached its highest level on record this spring.
Economic sentiment (ESI) in the euro area, April 2026
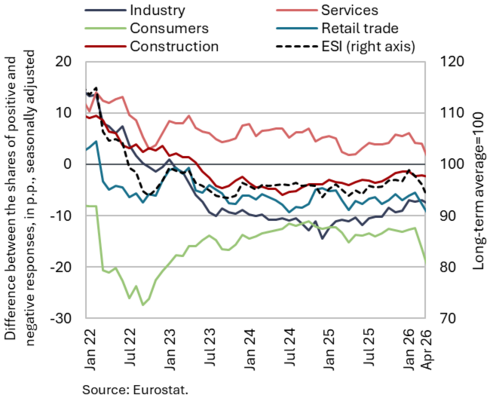
Economic sentiment indicators for the euro area deteriorated sharply in April due to the war in the Middle East, pointing to a decline in activity at the beginning of the second quarter. The euro area composite Purchasing Managers’ Index (PMI) fell below the 50-point threshold separating expansion from contraction for the first time in a year and a half. The manufacturing PMI, which had been gradually improving since the beginning of the year, rose further in April (52.3), partly due to the build-up of inventories amid expectations of further price rises and tighter supply constraints. By contrast, the services PMI declined markedly (47.4), reaching its lowest level since February 2021. The Economic Sentiment Indicator (ESI) declined for the third consecutive month in April, falling to its lowest level since November 2020. Sentiment deteriorated across all sectors, particularly in services and retail trade, while the decline was even more pronounced among consumers. Compared with the same period last year, sentiment in April was also weaker, mainly due to lower consumer confidence. In Germany, Slovenia’s largest trading partner, all major economic sentiment indicators (PMI, ESI, ZEW, Ifo) deteriorated significantly in April. The Ifo indicator fell to its lowest level since May 2020, with confidence deteriorating markedly across all sectors.
Economic growth in Slovenia’s main trading partners, Q1 2026
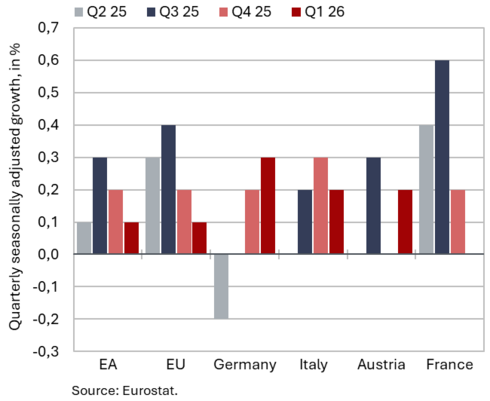
Economic growth in the euro area slowed in the first quarter. Following growth of 0.2% in the fourth quarter of 2025, euro area GDP increased by 0.1% in the first quarter of this year (0.8% year-on-year; seasonally adjusted). Among Slovenia’s main trading partners, GDP in Germany increased by 0.3% (with year-on-year growth also standing at 0.3%), supported by stronger private and government consumption and higher exports. Driven by stronger exports, GDP in Italy grew by 0.2% quarter-on-quarter (0.7% year-on-year), and Austria likewise recorded 0.2% quarterly growth (0.6% year-on-year). In France, economic activity stagnated quarter-on-quarter due to weaker private consumption, investment and exports, while year-on-year growth reached 1.1%. At the beginning of the year, developments in the euro area were somewhat more favourable in private consumption, while conditions in manufacturing and construction were less favourable. Manufacturing production in the euro area fell by 4.6% in the first quarter compared with the fourth quarter of last year and by 1.7% year-on-year. The volume of retail trade stagnated quarter-on-quarter but remained higher than in the first quarter of last year (1.5%). Construction activity declined in February for the second consecutive month, both month-on-month and year-on-year. On average, in the first two months of the year it was 3% lower than in the same period last year.
Commodity prices, April 2026
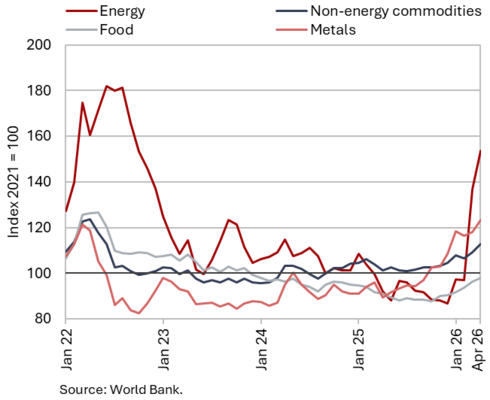
Brent crude oil prices increased further in April due to the war in the Middle East, while the average price of non-energy commodities also rose; by contrast, the price of natural gas on the European market declined. The average dollar price of Brent crude oil increased by 14.2% to USD 117.8 in April, while the euro price rose by 12.8% to EUR 100.7. Compared with April last year, oil prices were 72.7% higher in US dollar terms and 65.6% higher in euro terms. Dollar-denominated oil prices reached their highest level since June 2022 in April. From the outbreak of the war in Iran (late February) to the end of April, the price of Brent crude increased by 74%, reaching USD 124 per barrel. Following an increase in March, the average euro price of natural gas on the European market (Dutch TTF) declined by 14.5% in April to EUR 45.2/MWh. Year-on-year, natural gas prices were 28.4% higher. Gas prices also remain exposed to heightened risks due to historically low storage levels in Europe. According to the World Bank, the average dollar price of non-energy commodities rose by 3.2% month-on-month in April and by 11.2% year-on-year. On a monthly basis, fertiliser prices recorded the largest increase (14.1%) and were also substantially higher year-on-year (61.5%). Metal prices were likewise considerably higher than a year earlier (42.1%).
Gross domestic product, Q1 2026
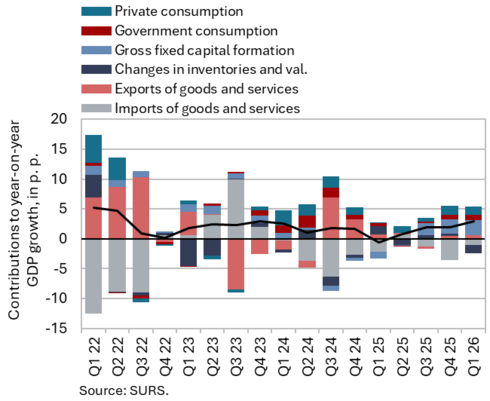
In the first quarter of this year, the war in the Middle East had not yet had a visible impact on economic activity; economic growth strengthened. In the first quarter of 2026, GDP increased by 0.7% quarter-on-quarter (seasonally adjusted) and was 3.0% higher year-on-year (the latter was also significantly affected by last year’s low base effect). Growth exceeded expectations mainly due to stronger export activity (0.7% year-on-year), while import growth (1.5% year-on-year) remained higher than export growth, although it slowed compared with last year. Goods exports were 1.8% higher year-on-year, driven particularly by higher exports of pharmaceutical products and, following last year’s decline, by exports of road vehicles and metals. Exports of services declined (-2.9%). Moderate growth in private consumption continued (2.7% year-on-year). Households increased spending primarily on motor vehicles, non-food products, and tourism-related services both domestically and abroad. Investment growth also continued (12.6% year-on-year), particularly in construction investment, while investment in equipment and machinery also recorded positive developments. Growth in government consumption strengthened somewhat in the first quarter (3.9% year-on-year), mainly due to higher expenditure on long-term care, increased employment in the general government sector, particularly in health and social work activities, and higher spending on goods and services.
Trade in goods – in real terms, March 2026
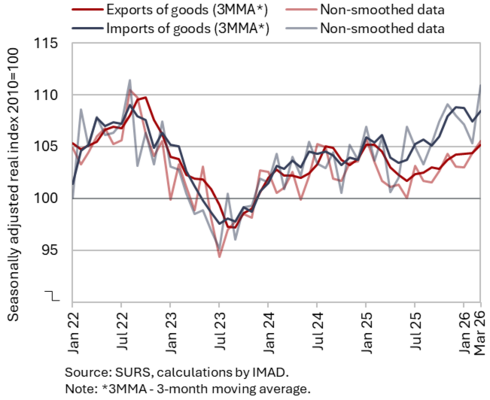
Goods exports increased quarter-on-quarter in the first quarter of this year, while imports declined (seasonally adjusted); both remained higher year-on-year. Compared with the previous quarter, real exports of goods increased by 0.9% (including a 2.2% increase in exports to the EU), while imports declined by 0.3% following decreases in January and February (including a 0.6% fall in imports from the EU). Exports were driven by higher exports of metals, pharmaceutical and metal products, and primary products (excluding petroleum products), while exports of vehicles also increased slightly (to France and Germany). By contrast, exports of other machinery and equipment – which account for around one-fifth of total exports – declined significantly. On the import side, imports of intermediate and capital goods decreased, while imports of consumer goods increased. Imports of petroleum products rose markedly in both value and volume terms in March; nevertheless, owing to negative developments in January, they declined quarter-on-quarter overall in the first quarter. Compared with the same period last year, both exports and imports of goods remained higher in the first quarter of this year (by 1.0% and 2.5% respectively), while only imports from EU countries were slightly lower.
Export orders showed no significant change in April and remained at a relatively low level. In the second quarter, companies continued to cite uncertain economic conditions, weak foreign demand, and a shortage of skilled labour as the main limiting factors to business operations. Amid heightened uncertainty in the international environment due to the war in the Middle East, the risk of shortages of raw materials also increased, although it remains at a relatively low level.
Trade in services – in real terms, March 2026
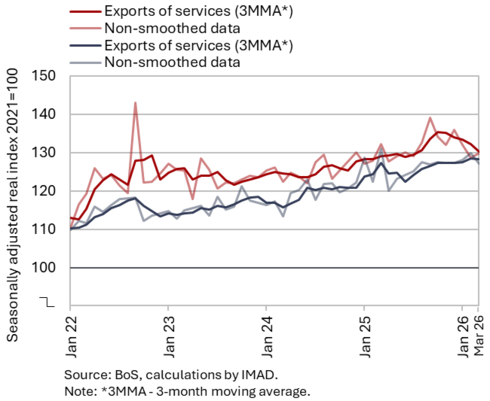
In the first quarter of this year, real exports of services declined month-on-month, while imports increased; both were lower year-on-year. Exports of services declined for the second consecutive quarter (–1.6%). According to detailed balance of payments data, the decline was driven mainly by lower exports of manufacturing services on physical inputs owned by others, as well as lower exports of ICT and construction services. Exports of tourism-related services remained at the level of the previous quarter, while exports of transport services (excluding electricity transmission) and other business services increased. Imports of services increased quarter-on-quarter by 1.1%, mainly due to higher imports of other business services (all seasonally adjusted).
Following growth in previous quarters, exports of services declined by 2.9% in the first quarter, with manufacturing services contributing most to the decline, which we associate with a markedly lower volume of goods processing transactions with Switzerland at the beginning of this year. Exports of ICT, construction and transport services also declined, while the other main groups remained at a similar level as a year earlier. Services imports were 1.1% lower, with the largest declines recorded in imports of ICT and transport services.
Production volume in manufacturing, March 2026
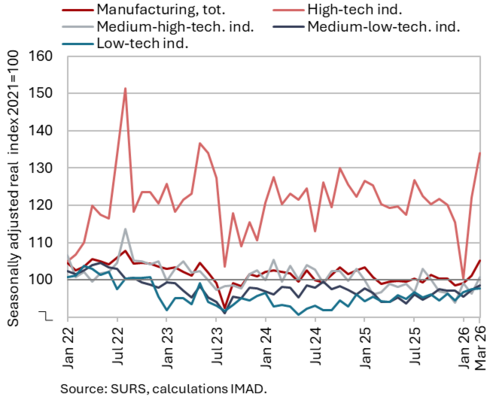
Following a further monthly increase in March (seasonally adjusted), manufacturing output in the first quarter exceeded the level recorded a year earlier (by 1.1%). On a monthly basis, output increased across all groups of industries by technological intensity. In medium-high-technology and low-technology industries, average output in the first three months of the year also exceeded the levels recorded in the fourth quarter of last year (seasonally adjusted). Compared with the first quarter of last year, total manufacturing output was 1.1% higher (working-day adjusted), while it declined in all energy-intensive industries, in the manufacture of electrical equipment and, according to our estimate, in the pharmaceutical industry (output in the latter two industries had also declined in 2025). Output was also lower in certain low-technology industries (wood-processing and furniture, textiles and printing). Following a decline in the previous year, the manufacture of fabricated metal products and the manufacture of machinery and equipment recorded higher year-on-year output in the first quarter. After a prolonged period of contraction, output also increased in the manufacture of motor vehicles, trailers and semi-trailers.
At the beginning of the second quarter, the indicator of expected manufacturing output remained low (and below the level recorded a year earlier). More than half of the surveyed enterprises identified uncertain economic conditions as an important limiting factor, alongside insufficient (foreign and domestic) demand and shortages of skilled workers.
Activity in construction, March 2026
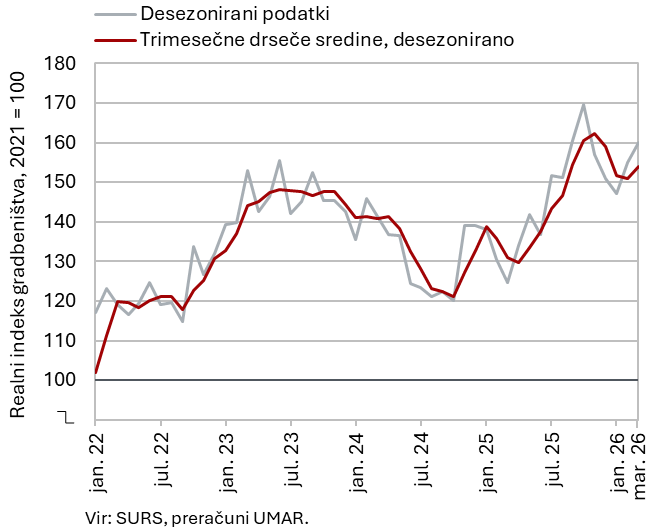
In March, the value of construction work put in place increased again (seasonally adjusted) and was also significantly higher than a year earlier (30%). After declining at the beginning of 2025, construction activity gradually strengthened over the year, peaking in October, before declining until January this year and strengthening again in February and March (seasonally adjusted). This dynamic was primarily driven by developments in civil engineering works.
However, some other data suggest weaker growth in construction activity. According to VAT data, activity in the first quarter was 11% higher year-on-year, which is 10 p.p. lower than indicated by the data on the value of construction work put in place. Similarly, data on output in the manufacture of non-metallic mineral products, which is traditionally closely linked to construction activity, do not indicate such strong growth, with production declining by 3% year-on-year in the first quarter.
Value of fiscally verified invoices, April 2026
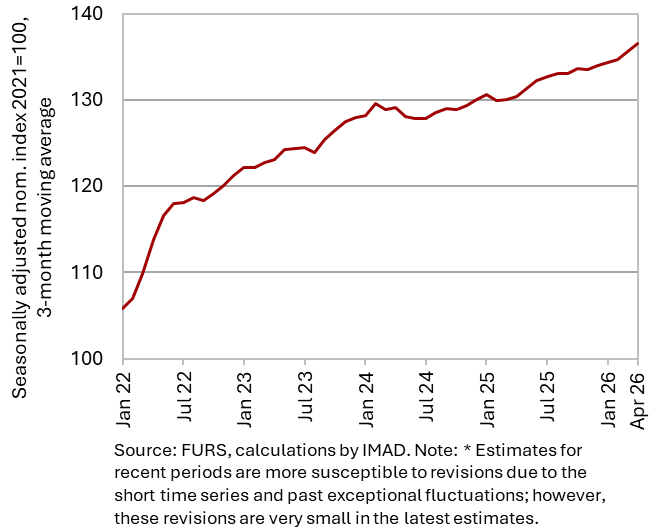
Year-on-year growth in the nominal value of fiscally verified invoices moderated in April following strong growth in March, which had mainly reflected a sharp increase in motor fuel sales. With one working day fewer than in April 2025, year-on-year growth slowed from 8% to 3%, similar to the rate recorded in February. Growth in trade sales slowed markedly (from 9% to 3%, compared with 2% in February), with the trade sector accounting for three quarters of the total value of fiscally verified invoices issued. The moderation in growth was mainly due to a year-on-year decline in motor fuel sales in retail trade, which had increased sharply in March owing to announced price rises following higher oil prices on global markets and also lower fuel prices than in neighbouring countries. Growth in most other retail trade activities remained similar to that in March, while wholesale trade sales declined year-on-year in April following strong growth in March. Year-on-year growth in accommodation and food service activities remained relatively high in April (8%), with these activities accounting for almost one tenth of the total value of fiscally verified invoices. By contrast, growth in sales in cultural, sports, recreational and other service activities remained low at 2%.
Turnover in trade, February 2026
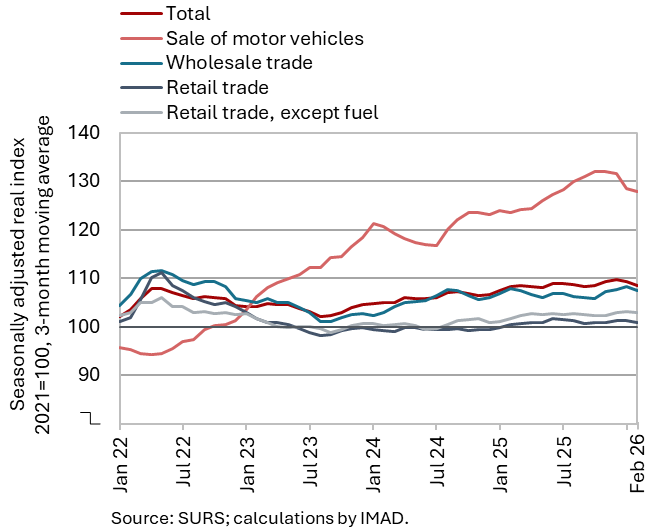
After increasing in the fourth quarter of last year, real turnover in most trade sectors declined for the second consecutive month in February and was also lower year-on-year. After relatively strong growth in December, sales in retail trade in food and non-food products continued to decline in February. Sales in wholesale trade also declined for the third consecutive month. By contrast, turnover in the sale of motor vehicles recorded a strong increase after three months of decline (all seasonally adjusted) and was the only trade sector to record year-on-year growth. Taken together, turnover in January and February was higher year-on-year in the sale of motor vehicles and in retail trade of non-food products (by 0.9% in both cases), while it was lower in retail trade of food products (–2.3%) and in wholesale trade (–1.2%).
Turnover in market services, February 2026
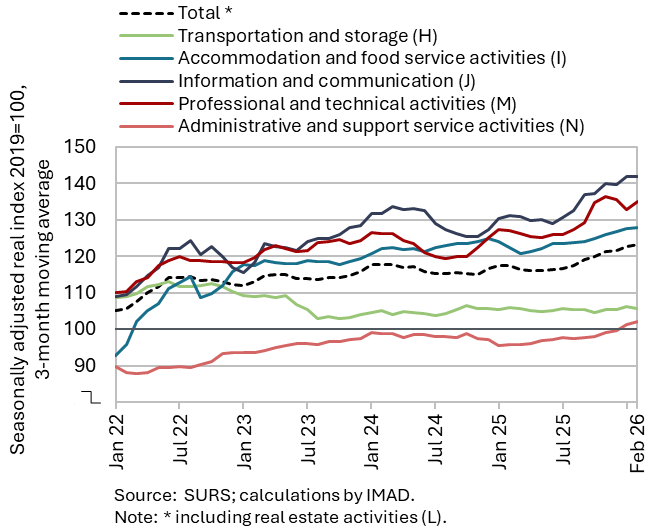
Total real turnover in market services increased slightly in February (seasonally adjusted) and was also higher year-on-year. Turnover in information and communication has been strengthening since the second half of last year, particularly in computer services. In professional and technical activities, following a decline at the end of last year, turnover rebounded strongly in February, especially in architectural and engineering services. Turnover in accommodation and food service activities has been increasing since last spring. In transportation and storage, it declined somewhat in February, but has mostly stagnated since the end of 2024. In administrative and support service activities, turnover has been gradually increasing since the beginning of last year and has slightly exceeded its 2019 level since the start of this year (all seasonally adjusted). On average in the first two months, total real turnover was 5.4% higher year-on-year; only in transportation was it slightly lower than a year earlier (by 0.6%).
Selected indicators of household consumption, Q1 2026
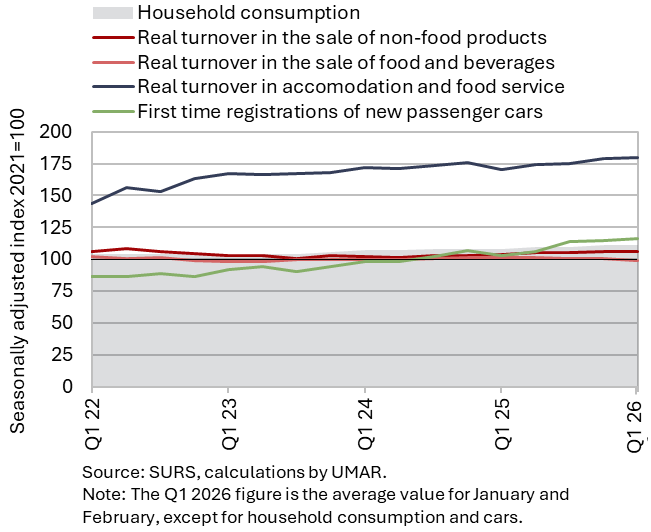
In the first quarter, household consumption was 2.7% higher year-on-year. Households spent more than a year earlier on new passenger cars (the number of new cars sold to private individuals was 6% higher year-on-year) and non-food products. Year-on-year, spending on tourism services increased both abroad (by 6% in nominal terms, while the number of overnight stays by Slovenian residents in Croatia rose by 9%) and domestically (with the number of domestic overnight stays in Slovenia increasing by 4%). According to national accounts data, households also increased their spending on non-durable goods year-on-year, although data on real turnover in food, beverages and tobacco retail trade for January and February combined indicate a 2% year-on-year decline in turnover.
Electricity consumption by consumption group, April 2026
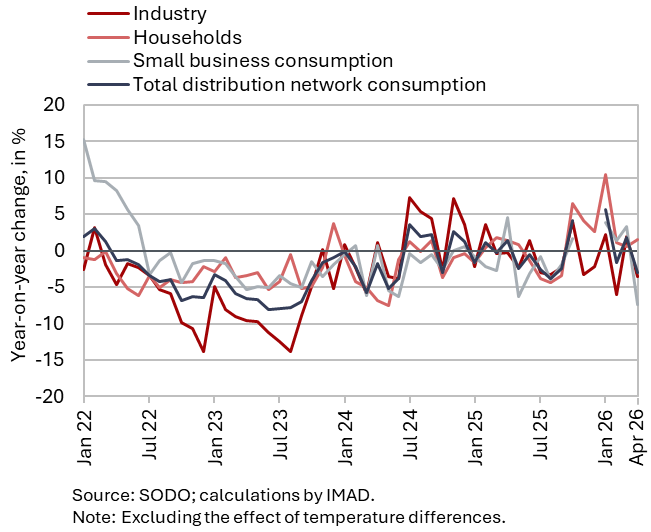
Electricity consumption in the distribution network was 3.0% lower year-on-year in April. Industrial consumption and consumption by other business consumers – both indicative of economic activity – decreased year-on-year by 3.5% and 7.4%, respectively, partly reflecting one fewer working day. By contrast, household electricity consumption increased by 1.6% year-on-year.
Economic sentiment, April 2026
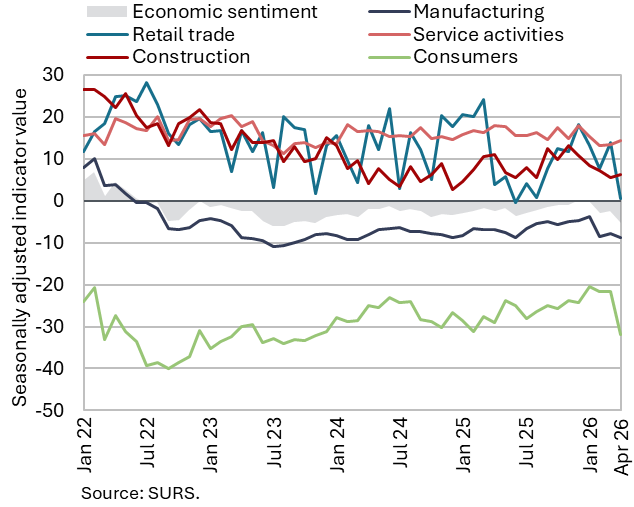
The economic sentiment indicator declined in April, reflecting the impact of the war in the Middle East, and fell to its lowest level since the second half of 2023. The deterioration was driven mainly by the consumer confidence indicator, which fell by 10 p.p., marking the largest decline since March 2022. The indicator also decreased in retail trade (by 13 p.p., although it is highly volatile month-to-month) and, to a lesser extent, in manufacturing. By contrast, confidence in service activities increased slightly, while in construction it remained unchanged from the March level. Compared with April last year, all confidence indicators were lower. Relative to the long-term average, the overall indicator and the confidence indicators in retail trade, manufacturing and among consumers remained below their respective averages.
Number of persons in employment, March 2026
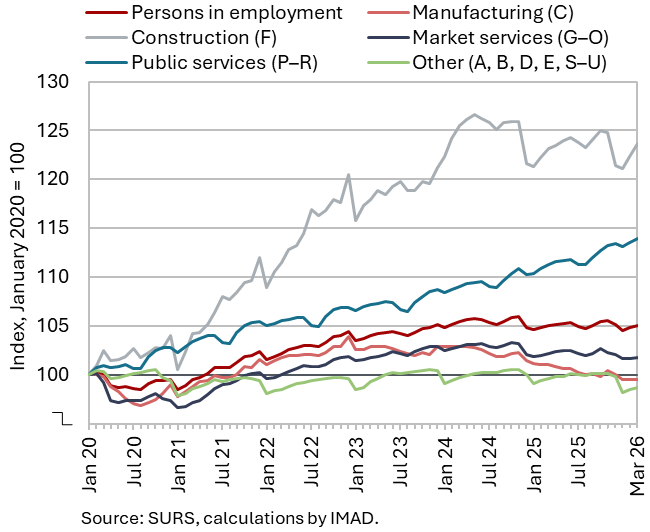
According to the Statistical Register of Employment (SRDAP), the number of persons in employment in March remained broadly unchanged relative to previous months (seasonally adjusted) and compared with a year earlier. The number of employees declined slightly year-on-year (–0.2%), while the number of self-employed increased (0.9%). While the overall number remained relatively stable, significant differences across activities persisted: the largest year-on-year declines in the number of persons in employment were recorded in manufacturing (–1.5%) and trade (–1.3%), whereas employment increased in public service activities, particularly in health and social work (3.6%). The number of foreign citizens in employment increased by 2.6% year-on-year in March, while the number of Slovenian nationals in employment declined by 0.4%, mainly due to retirements.
Number of registered unemployed, April 2026
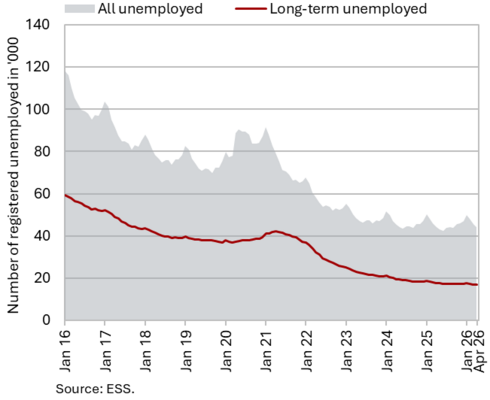
The number of registered unemployed fell month-on-month in April (seasonally adjusted) and was also slightly lower year-on-year (both by 0.4%). According to original data, 44,175 people were unemployed at the end of April, 3.5% less than at the end of March. The year-on-year decline in the number of long-term unemployed and unemployed persons aged over 50 continued (down 5.6% and 3.7% respectively). The number of unemployed young people (aged 15–29), which has recorded year-on-year increases since October 2024, exceeded its level from a year earlier by 4.7% in April, reaching 9,417 persons. This may be at least partly related to the increase in the size of cohorts entering the labour market (between 2023 and 2025, the number of residents aged 15–29 increased by ten thousand), while demand for labour has moderated.
Average real gross wage per employee, February 2026
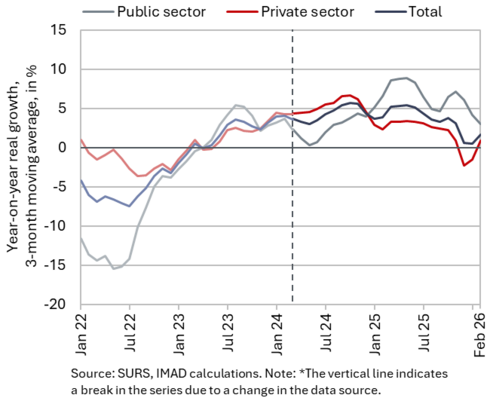
The year-on-year nominal growth in the average gross wage remained high in February (7.2%): 7.8% in the private sector and 5.9% in the public sector. Growth in the private sector was primarily influenced by a 16% increase in the minimum wage at the beginning of the year. The highest year-on-year wage growth in February was recorded in construction, accommodation and food service activities, and administrative and support service activities (including employment agencies), which are activities with the highest shares of minimum wage recipients. In the public sector, growth remained relatively high, linked to the wage reform involving the agreed increase in base wages at the beginning of last year and to collective bargaining agreements.
In the first two months of 2026, the overall average gross wage increased by 4% in real terms (by 7% in nominal terms) – by 2.8% in the public sector and by 4.6% in the private sector (by 5.7% and 7.5% in nominal terms respectively).
Consumer prices, April 2026
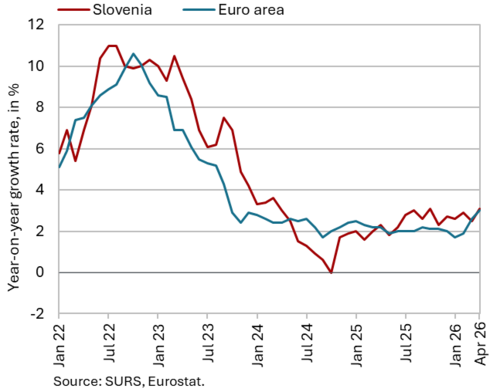
Year-on-year growth in consumer prices strengthened more markedly in April (3.1%) compared to March (2.5%), while prices increased by 1.9% month-on-month, the highest rise since June 2022 (2.7%). Prices of liquid fuels rose by almost one third (32.1%) month-on-month in April, driven by the war in the Middle East, while prices of motor fuels and lubricants increased by around one fifth (18.6%). Prices in the housing, water, electricity, gas and other fuels group were around one tenth higher, and prices in the transport group were nearly 5% higher; together, they contributed almost two thirds of year-on-year inflation. Within the two groups, prices of petroleum products (liquid fuels and motor fuels combined) increased by 17.5%. Year-on-year growth in prices in the food and non-alcoholic beverages group continued to slow, reaching 1%, the lowest level since July 2024. Prices of semi-durable goods were 2.2% lower year-on-year, reflecting somewhat less pronounced seasonal price increases in the clothing and footwear group, while prices of durable goods were also lower (by 0.4%). Year-on-year growth in services prices remained broadly stable (3.6%). Year-on-year inflation, measured by the HICP, stood at 3.4% in Slovenia in April, which is 0.4 p.p. above the estimated level in the euro area.
Slovenian industrial producer prices, March 2026
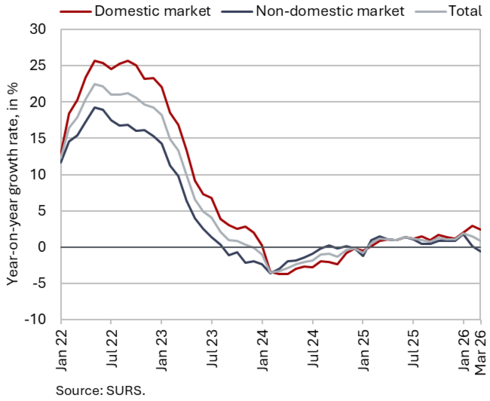
In March, Slovenian industrial producer prices increased slightly on a monthly basis (by 0.2%), while year-on-year growth slowed slightly for the second consecutive month, to 0.9% (from 1.5%). Energy prices were the main factor behind the moderation in year-on-year growth; in March they were lower year-on-year (by 2.8%), reflecting a monthly decline in electricity, gas and steam supply prices (by 5.3%) as well as a higher base effect. Prices of capital goods were also lower year-on-year (albeit marginally, by 0.1%). Year-on-year growth in the prices of intermediate goods slowed by 0.4 percentage points compared with February, to 1.1%. By contrast, price growth in the durable consumer goods group strengthened more markedly (to 5.1%). Price growth in the non-durable consumer goods group continued to gradually slow (to 1.2%). Price growth of industrial products on the domestic market stood at 2.4% in March and, for the second consecutive month, significantly exceeded growth on foreign markets, where prices declined year-on-year (by 0.6%) in March. Price growth on the domestic market exceeded that on foreign markets in all main industrial groups, with the exception of energy.
Loans to domestic non-banking sectors, March 2026
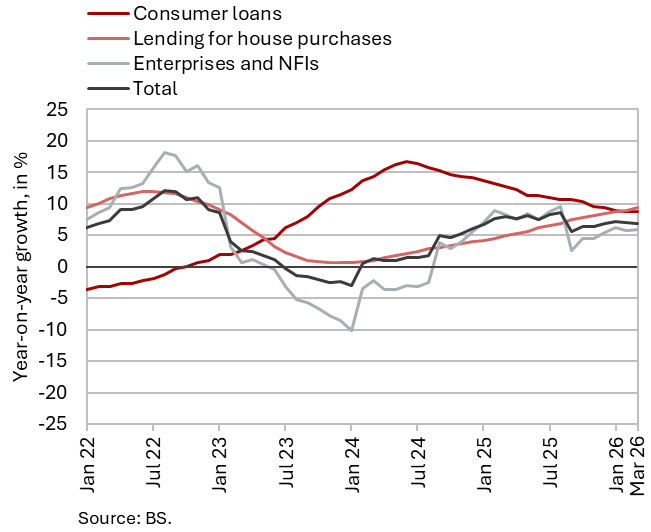
Year-on-year growth in loans to the domestic non-banking sector has remained broadly stable since the end of last year, at around the levels reached (6.9%). Growth in loans to enterprises and NFIs fluctuated around 6%. At the same time, growth in household loans has continued to strengthen gradually (8.1%), mainly owing to increased borrowing in the form of housing loans, which were 9.4% higher year-on-year. The volume of new housing lending in the first three months of this year was around 30% higher than in the same period last year. Year-on-year growth in non-banking sector deposits strengthened to 7.1%. The maturity structure of deposits continues to deteriorate. Overnight deposits were almost 10% higher year-on-year and already accounted for more than 83% of all deposits of non-banking sectors. By contrast, the volume of term deposits was 7.4% lower. Following an increase at the end of last year, when it rose somewhat particularly in manufacturing activities, the share of non-performing exposures in the banking system remained unchanged at 1.6% in February.
Current account of the balance of payments, March 2026
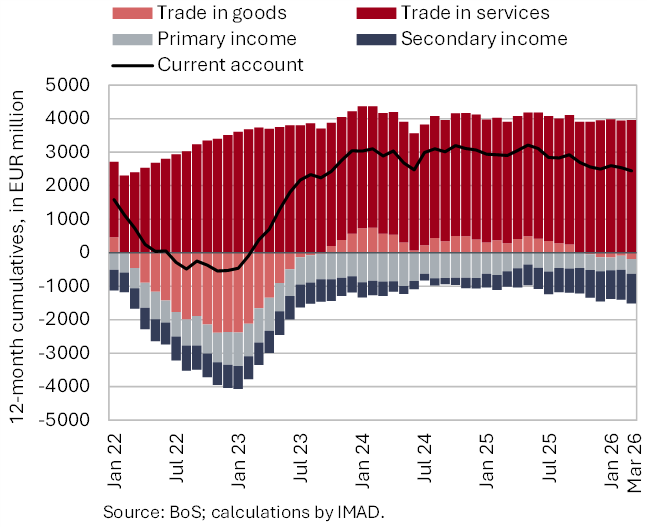
The war in the Middle East has not yet had a notable impact on the volume of goods trade or external trade prices; the current account surplus was only slightly lower year-on-year in the first quarter of this year. This was mainly due to the goods trade balance. Real exports of goods increased year-on-year, while imports recorded even stronger growth and the terms of trade deteriorated slightly. We estimate that the volume developments contributed EUR 38 million to the year-on-year decline in the balance of goods trade in the first quarter (EUR 55 million), while the terms of trade contributed a further EUR 17 million. The services surplus was slightly higher year-on-year, mainly due to a higher surplus in trade in insurance services and transport services. By contrast, the surplus in trade in manufacturing services on physical inputs owned by others and the surplus in construction services trade were lower year-on-year. The surplus in primary income was lower mainly due to higher net interest payments by the government to the rest of the world. Meanwhile, the lower deficit in secondary income stemmed primarily from higher net receipts of premiums related to exports of motor insurance services. In March, the 12-month current account balance showed a surplus of EUR 2.4 billion (3.5% of estimated GDP for 2026).
Revenue (top figure) and expenditure (bottom figure) of the consolidated general government budgetary accounts, Q1 2026
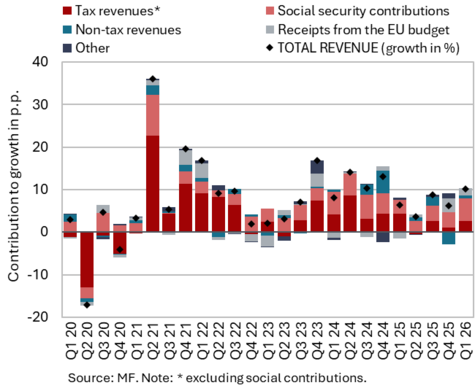
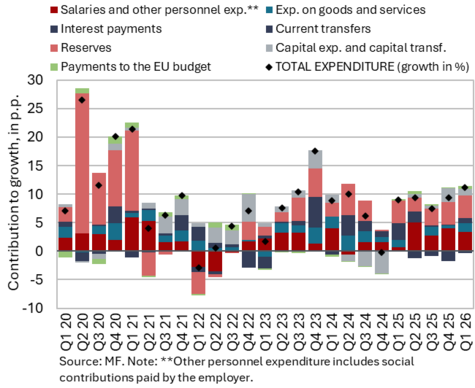
The deficit of the consolidated general government balance amounted to EUR 698 million in the first quarter of this year, which was EUR 133 million higher than in the same quarter last year. Revenues rose by about 10% in the first quarter, exceeding the growth recorded in the same period last year (6.5%). Year-on-year, growth strengthened particularly in social contributions, reflecting the introduction of the long-term care contribution in July last year. Growth also accelerated in revenues from value added tax, personal income tax and EU funds (related to the implementation of the Recovery and Resilience Plan). By contrast, excise duty revenues were lower year-on-year. Expenditure in the first quarter of this year was 11.2% higher year-on-year, representing slightly higher growth than in the same quarter last year (9.1%). The increase in expenditure was driven mainly by higher compensation of employees due to the implementation of the wage reform and by transfers. The increase in transfers to individuals and households stemmed mainly from higher expenditure on pensions, unemployment benefits, which increased at the beginning of this year, personal assistance, and higher transfers to war invalids, veterans and victims of wartime violence. Transfers for the provision of public service in scheduled passenger transport based on newly awarded concessions also continued to increase. Investment expenditure was higher year-on-year, particularly for the purchase of military equipment and investments in new construction, reconstruction and renovation.
EU budget receipts, Q1 2026
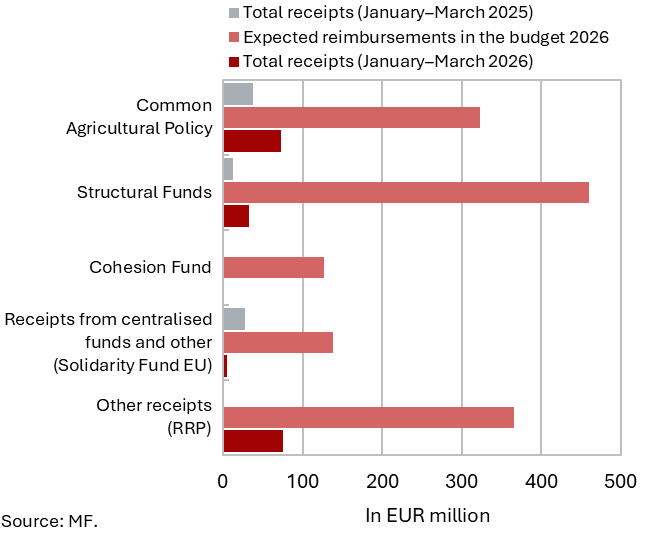
Slovenia received EUR 185.3 million in the first quarter of 2026, while its net position was negative (EUR -6.2 million). In this period, it received EUR 185.3 million from the EU budget, i.e. EUR 105.5 million more than in the first quarter last year. In the same period, it contributed EUR 191.6 million to the EU budget (EUR 156.3 million in 2025). Higher inflows are mainly related to the implementation of the Recovery and Resilience Plan (around EUR 75 million) and projects financed from the Structural Funds (around EUR 33 million). On the basis of the fifth payment request under the Recovery and Resilience Facility, submitted in December last year, Slovenia received an additional EUR 230.7 million from the EU budget in April (taking into account pre-financing already received). In March 2026, it also submitted the sixth (penultimate) request, with a maximum possible net disbursement of around EUR 41 million.