Slovenian Economic Mirror
Slovenian Economic Mirror 3/2025
Economic growth in the euro area strengthened slightly in the first quarter. However, amid exceptionally high uncertainty, particularly related to US trade policy, the International Monetary Fund (IMF) revised its global economic growth forecast downwards. In Slovenia, gross domestic product (GDP) declined by 0.8% quarter-on-quarter in the first quarter of this year and was 0.7% lower year-on-year. Investment activity continued to decrease, with a sharp drop in construction investment, particularly in civil engineering. Activity in the export sector was also lower than last year, likely reflecting increased uncertainty in the international economic environment in anticipation of, and following, the introduction of US tariff measures. Despite relatively strong real wage growth and high employment levels, the growth of private consumption remained modest. This suggests a degree of household caution in spending, with the savings rate estimated to have increased slightly further, as also indicated by the decline in consumer confidence observed in the early months of the year. The value of the economic climate indicator remained slightly higher in April compared to the same period last year. Consumer prices in April were 2.3% higher year-on-year, recording a similar rate of increase as in the euro area for the first time in a year. This issue presents two selected topics – the business performance of companies in Slovenia in 2024 and the Sustainable and Inclusive Wellbeing (SIWB) index, including a comparison with Slovenia’s main trading partners. The analysis, among other things, indicated that Slovenia manages its economic resources effectively according to the composite SIWB index. It performs strongest in the area of inclusion and wellbeing, ranks in the upper half of the EU in the area of nature (environment) and resources for the future, but falls into the lower half in the areas of institutions and social resilience.
Economic growth in Slovenia’s main trading partners, Q1 2025
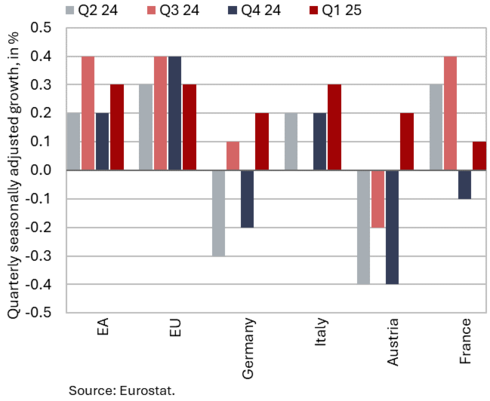
Economic growth in the euro area strengthened in the first quarter. Following a 0.2% growth in the fourth quarter of 2024, euro area GDP rose by 0.3% quarter-on-quarter in the first quarter of 2025 (1.2% year-on-year). A significant contribution to this growth came from Ireland, where GDP expanded by 3.2% on a quarterly basis and 10.9% year-on-year. In the EU as a whole, quarterly growth stood at 0.3%, and year-on-year growth at 1.4%. All main Slovenian economic partners recorded quarterly economic growth. Compared to the previous quarter, GDP rose by 0.3% in Italy, by 0.2% in both Germany and Austria, and by 0.1% in France. Economic sentiment indicators for the euro area presented a mixed picture at the beginning of the second quarter, amid heightened uncertainty regarding tariffs and potential tightening of trade policies. The value of the composite Purchasing Managers’ Index (PMI) remained above 50 in April – a threshold indicating expanding activity. The services PMI continued to indicate growth (50.1), although it deteriorated slightly, and the manufacturing PMI improved further, signalling a smaller contraction in activity than in previous months (49). The Economic Sentiment Indicator (ESI) declined markedly due to a deterioration in confidence across all sectors and among consumers, while the Ifo index, which measures sentiment in the German economy, edged up slightly on the back of improved assessments of the current situation.
Economic growth outlook, April 2025
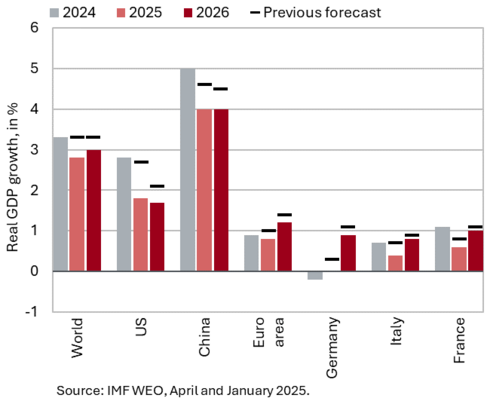
In April, amid significant trade and geopolitical uncertainty, the IMF revised its forecasts for global economic growth downwards. In its reference scenario, the IMF projects global GDP growth of 2.8% this year and 3.0% next year (after 3.3% growth last year). Compared to January, the forecast has been revised down by 0.5 p.p. for this year and by 0.3 p.p. for 2026. Global trade is expected to grow by 1.7% this year, which is 1.5 p.p. lower than in the January forecast. Growth is projected to strengthen to 2.5% next year (0.8 p.p. below the January forecast). For the United States, growth was revised down by 0.9 p.p., to 1.8%, with growth expected to remain largely unchanged in 2026. The IMF revised its growth forecast for the euro area – where the impact of tariffs is expected to be relatively smaller – down by 0.2 p.p. for both this year and the next, to 0.8% and 1.2%, respectively. Growth is expected to be supported primarily by private consumption, driven by rising real wages and expansionary fiscal policy (particularly in Germany). The German economy is projected to stagnate this year but recover in 2026 (0.9%) on the back of strong fiscal stimulus. The fiscal stimulus is also expected to support growth in China this year and next, with the IMF projecting annual growth of 4% for 2025 and 2026 (a downward revision of 0.5 p.p. compared to the January forecast for each year). The realisation of these forecasts is subject to exceptionally high uncertainty, particularly regarding US trade policy.
Commodity prices, April 2025
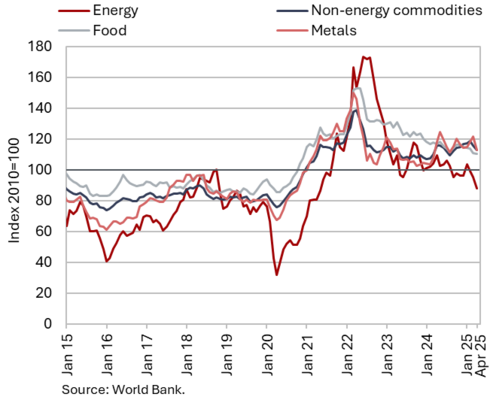
In April, the dollar prices of Brent oil and non-energy commodities continued to decline. The average dollar price of Brent crude oil decreased by 6.2% month-on-month to USD 68.19 and the euro price by 9.6% to EUR 60.83, amid a stronger euro. Year-on-year, the price of oil was 24% lower in US dollars and 27% lower in euros. Oil prices continued to fall in early May, reaching their lowest level in the past four years (below USD 62 per barrel), amid heightened uncertainty related to US trade policy and the announced increase in oil output by OPEC+. The average euro price of natural gas on the European market (Dutch TTF) declined by 15.8% in April (to EUR 35.2 per MWh), due to mild weather and increased liquefied natural gas (LNG) imports from the United States. On a year-on-year basis, the price was 21.8% higher. According to the World Bank, the average dollar price of non-energy commodities fell by 2.6% month-on-month in April and by 2.3% year-on-year. Amid high uncertainty surrounding future economic growth, metal prices in particular declined.
Gross domestic product, Q1 2025
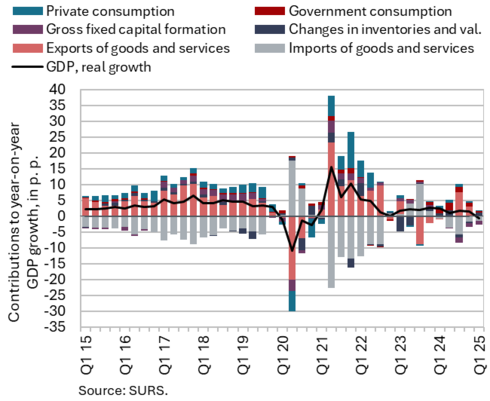
Economic activity in Slovenia contracted by 0.8% (seasonally adjusted) in the first quarter of this year, with GDP declining by 0.7% year-on-year. Investment activity continued to weaken in the first quarter: total gross fixed capital formation was 5.1% lower year-on-year. Amid heightened uncertainty, the contribution of inventories to economic growth was strongly positive (1.1 p.p.). Construction investment recorded a marked decline, with value added in construction falling by 6.0% year-on-year. Activity in the export sector was also below last year’s level, likely reflecting increased uncertainty in the international economic environment ahead of anticipated US tariff measures. Consequently, value added in manufacturing was down compared to a year earlier (-2.5%), and exports of goods and services declined slightly on a quarterly basis, while remaining broadly unchanged year-on-year (0.1%). Despite relatively strong real wage growth and high employment levels, private consumption growth was relatively subdued (0.4%). This indicated a degree of caution in household spending, with the savings rate estimated to have increased slightly further, as also reflected in the decline in consumer confidence observed in the early months of the year. Government consumption rose by 2.6%, driven primarily by higher expenditure on goods and services in healthcare and higher social transfers in kind, particularly spending on medical goods and health services.
Electricity consumption by consumption group, April 2025
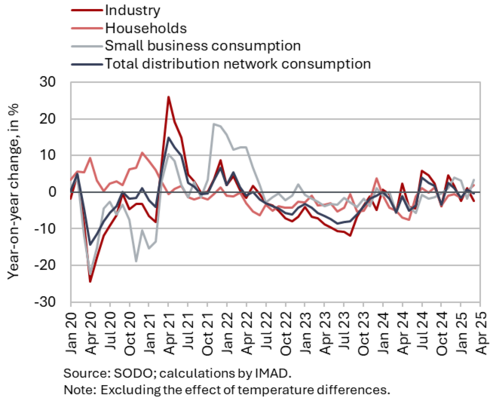
Electricity consumption in the distribution network was 1.7% higher year-on-year in April. Industrial consumption was roughly unchanged year-on-year in April, given the same number of working days, after having been lower year-on-year during the first three months of this year. Household consumption was 1.5% higher year-on-year in April, while small business consumption – which accounts for only a small share of total consumption – was 13% higher, due to a low base last year.
Trade in goods – in real terms, March 2025
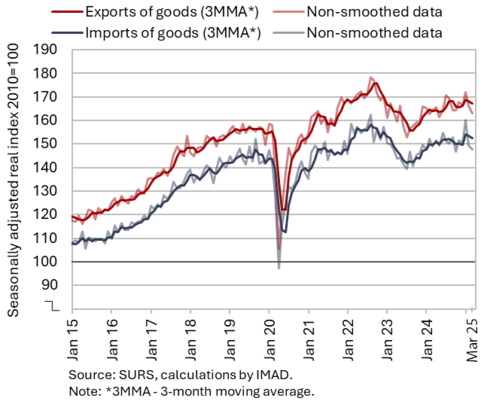
In the first quarter of this year, goods exports and imports increased quarter-on-quarter (seasonally adjusted) and were also higher year-on-year. The growth was driven by strong January figures, as real exports and imports of goods declined month-on-month in February and March. Exports of goods increased by 0.5% compared to the previous quarter (EU: 0.7%), and imports by 1.9%, marked by significant monthly fluctuations (EU: 3.5%). Goods exports rose in pharmaceuticals, metals and metal products, and primary products (excluding petroleum products), while exports of machinery and equipment (including vehicles) – which account for around one-quarter of total exports – declined the most. The increase in goods imports was mainly driven by imports of intermediate goods, while imports of consumer and capital goods also rose (seasonally adjusted). Compared to the same period last year, both exports and imports of goods remained higher in the first quarter of this year (by 1.3% and 1.9%, respectively), with the only decline recorded in imports from non-EU countries. Sentiment in export-oriented activities has not changed significantly in recent months and remains subdued, reflecting increased uncertainty in the international environment.
Trade in services – in real terms, March 2025
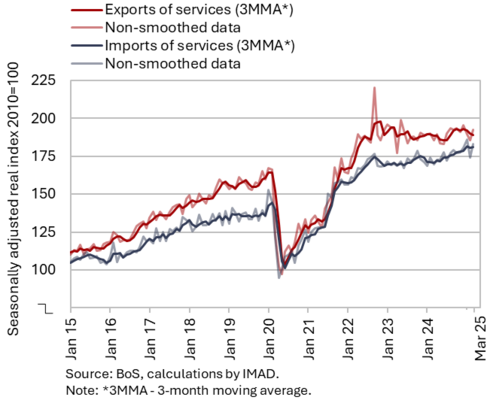
In the first quarter, real exports of services declined month-on-month but remained slightly higher year-on-year; real imports increased both month-on-month and year-on-year. Compared to the previous quarter, exports declined across most major service groups, with the largest contribution to the decrease coming from exports of other business services. Exports of transport services and tourism-related services also continued to decline, with the latter falling for the fourth consecutive quarter. Imports increased across most major service groups, except for tourism-related services and construction services (seasonally adjusted). Trade in services was higher than in the first quarter of 2024 (exports by 0.8%, imports by 6.5%), primarily due to a notable increase in exports and imports of other business services. The modest year-on-year growth in services exports was due to a decline in exports of transport services and tourism-related services, which together account for around half of total services exports.
Production volume in manufacturing, March 2025
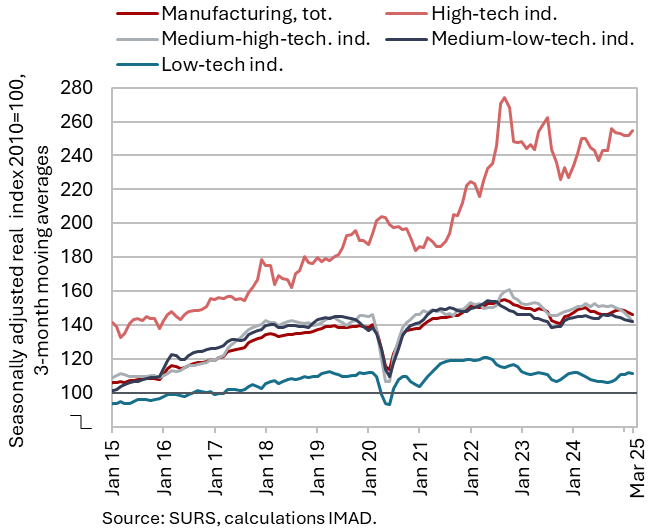
Manufacturing output contracted in the first quarter of this year (seasonally adjusted), following growth in the fourth quarter of last year, and was 2.3% lower year-on-year (working-day adjusted). Compared with the fourth quarter of 2024, output continued to increase in both high- and low-technology industries, although the growth was modest. Output in medium-technology industries, which largely produce intermediate goods for foreign markets, continued to decline (seasonally adjusted). Year-on-year, output decreased in the manufacture of fabricated metal products (following growth last year), machinery and equipment n.e.c., motor vehicles and other transport equipment (C29–C30). Year-on-year growth in energy-intensive industries was modest, while output declined in the low-technology paper industry. Most other low-technology industries also recorded lower output compared to a year earlier (only output in the wood industry, and to a lesser extent the food and furniture industries and other manufacturing, saw increases). According to our assessment, the year-on-year growth in high-technology industries was mainly driven by the pharmaceutical industry.
Activity in construction, March 2025
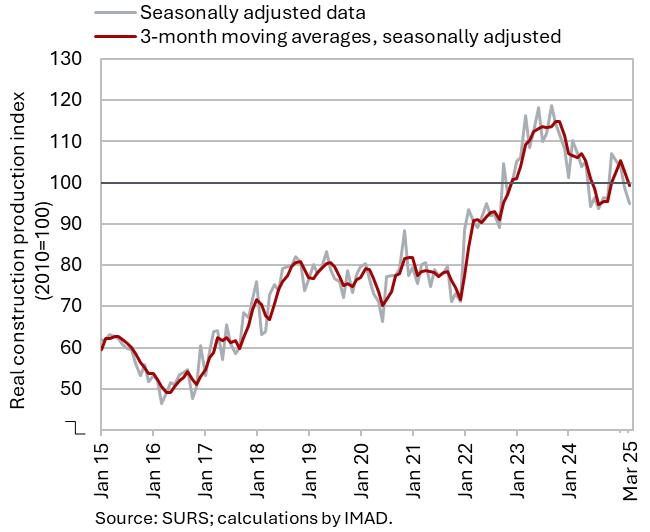
Following strong growth at the end of last year, construction activity declined in the first quarter of this year. Construction activity gradually declined over the course of last year, before surging in the fourth quarter (by 8% compared to the previous quarter). In the first quarter of this year, it declined again. The sharpest drop was observed in civil engineering, both compared to the previous quarter (-11%) and to the first quarter of last year (-22%).
Activity in civil engineering is traditionally linked to government investment activity. Capital expenditure (according to the consolidated general government budgetary accounts) was 7% higher in the first quarter than a year earlier; within this, expenditure on new constructions, reconstructions and renovations – which, according to IMAD, is most closely related to construction activity – increased by as much as 15%. The lower activity in civil engineering at the beginning of this year may thus be related to reduced investment by infrastructure companies and/or budgetary funds.
Turnover in trade, February 2025
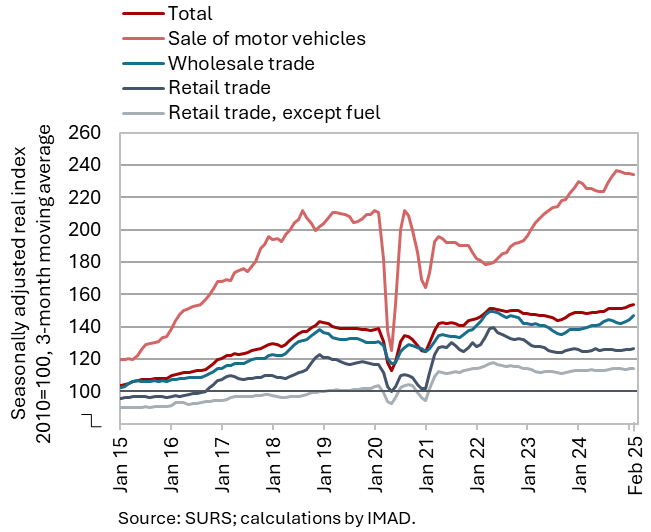
In February, real turnover increased in wholesale trade and sales of non-food products, while it declined in the sales of motor vehicles and food products; on average over the first two months, sales was higher year-on-year across all sectors. Wholesale trade and retail sales of non-food products increased in February for the second month in a row, following a decline in the fourth quarter of last year. Sales of motor vehicles and retail sales of food products, after increasing in January and declining in February, remained broadly unchanged on average in the first two months compared with the fourth quarter of last year, when a modest increase was recorded. On average over the first two months, turnover across all sectors was higher year-on-year, with the largest increases observed in wholesale trade (4%) and sales of motor vehicles (3%).
Turnover in market services, February 2025
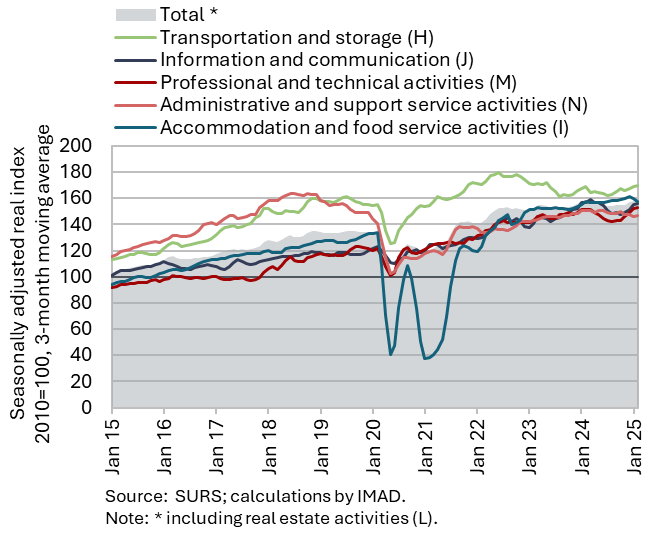
Total real turnover in market services declined again in February and was also slightly lower year-on-year in the first two months. Following a sharp drop in January, turnover decreased further in February (by 1.4% seasonally adjusted), with declines recorded across all activities except real estate activities. The most pronounced drop was recorded in information and communication, where the downturn deepened further after strong growth at the end of last year. Turnover in transportation and storage also fell slightly (particularly in storage) following growth at the end of last year. Turnover in accommodation and food service activities declined for the second consecutive month, after having strengthened during the second half of last year. A slight decline was also observed in administrative and support service activities, continuing a downward trend observed since mid-2024. After five months of growth, turnover also declined in professional and technical activities. On average in the first two months of the year, total real turnover in market services was 0.6% lower year-on-year. Only turnover in professional and technical activities and transportation was higher year-on-year.
Selected indicators of household consumption, Q1 2025
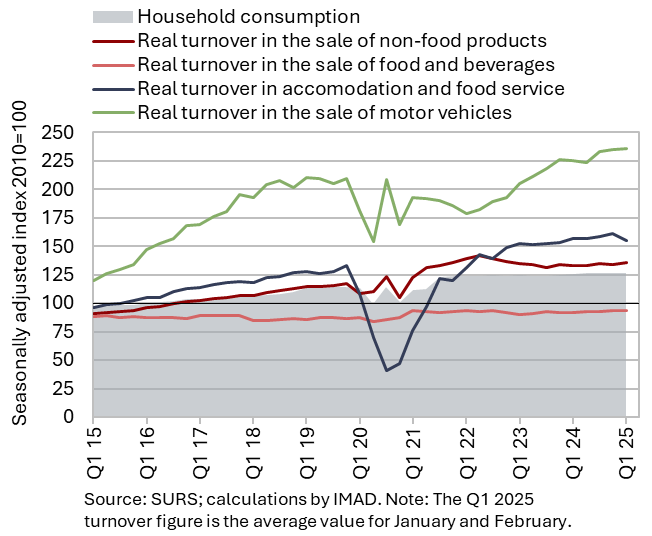
Household consumption in the first quarter was 0.4% higher year-on-year in real terms. The relatively modest growth in the first quarter was influenced not only by elevated uncertainty, but also by the fact that February had one day fewer this year and by the different timing of the Easter holidays (and the associated pre-holiday purchases). The number of new passenger cars sold in January and February was 8% higher compared to the same period last year, while real turnover from the sales of motor vehicles rose by 3%. Year-on-year growth was also recorded in spending on food, beverages and tobacco products, non-food products (turnover increased by 2% in real terms in both categories) and tourism services abroad (by 3% in nominal terms). In the first quarter, the number of overnight stays by domestic tourists in Slovenia was 3% lower year-on-year.
After the nominal value of fiscally verified invoices (used as a proxy for sales) remained broadly unchanged year-on-year in the first quarter, it rose by 5% year-on-year in April, indicating a strengthening of household consumption at the beginning of the second quarter.
Economic sentiment, April 2025
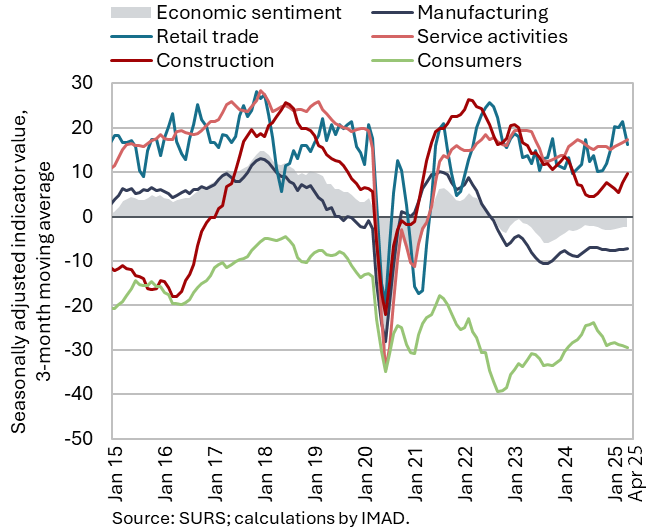
In April, the value of the sentiment indicator declined slightly compared to March but remained marginally higher than in April 2024. Month-on-month, confidence weakened among consumers and in retail trade, and these were also the only two indicators to record a year-on-year decline. Year-on-year, the confidence indicator in construction was higher, with slight improvements also observed in manufacturing and services. The economic sentiment indicator thus remains below its long-term average, while only the indicators for services and construction still exceeding their respective long-term averages.
Road and rail freight transport, Q4 2024
In the fourth quarter of 2024, the volume of road freight transport increased, while the volume of rail transport declined. The volume of road transport by Slovenian vehicles increased in both road traffic performed at least partially on Slovenian territory (exports, imports and national transport) and in cross-trade transport. The share of cross-trade in total transport was about 46%, which is 5 p.p. lower than pre-COVID levels. Year-on-year, the volume of road freight transport in the fourth quarter was 3% higher, but over the entire year 2024 it was lower by the same percentage. Rail freight transport in the fourth quarter declined by 5% year-on-year; however, due to growth in the second quarter, it was only 1% lower in the entire year. Compared to the same quarter in 2019, both rail and road transport in Q4 2024 were around 10% lower.
Number of persons in employment, March 2025
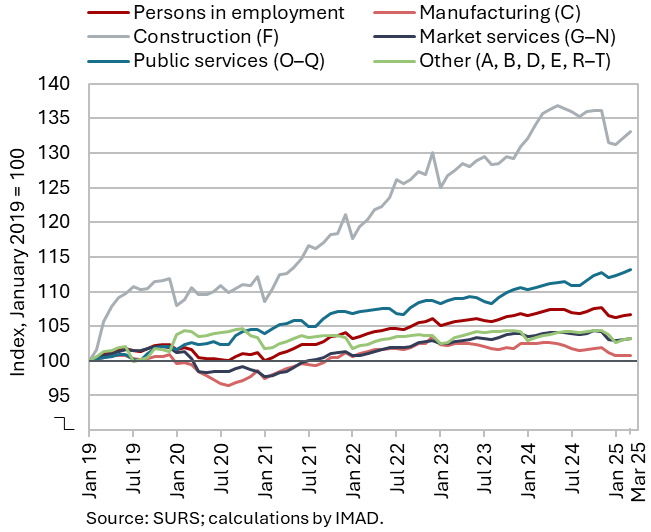
Following a decline at the end of last year, the number of persons in employment remained relatively stable in the first three months (seasonally adjusted). Year-on-year, the number of persons in employment decreased by 0.4% in March. The most significant decline was recorded in administrative and support service activities (-4.8%), mainly due to a significant decline in employment activities. A more notable decline was also recorded in manufacturing (-1.8%). In construction, employment was lower year-on-year in March for the third consecutive month (-1.9%), although labour shortages remain present in the sector. In contrast, year-on-year growth was observed in public service activities, particularly in human health activities (3.3%) and education (1.7%).
Number of registered unemployed, April 2025
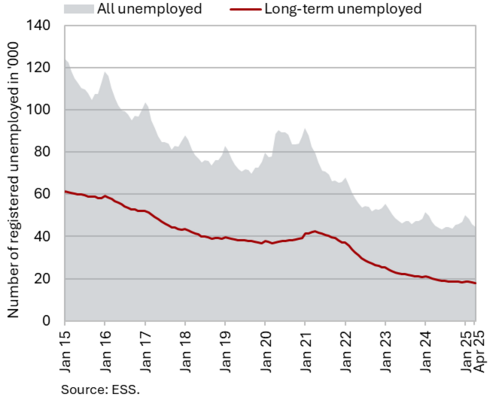
In April, the number of unemployed persons (seasonally adjusted) declined slightly (by 0.5%). According to original data, 44,355 people were unemployed at the end of April, 3.3% fewer than at the end of March. Year on year, unemployment was down 1.9%. This represents a smaller year-on-year decline than in previous months, which was influenced by a slightly higher inflow of redundant workers into unemployment, alongside a continued moderate outflow from the unemployment register. A smaller year-on-year decline was also recorded among the long-term unemployed (-9%), while the number of unemployed persons aged 55 and over remained broadly unchanged (-11.3%). In contrast, youth unemployment (ages 15–29) increased year-on-year (by 5.8%) for the seventh month in a row.
Average real gross wage per employee, February 2025
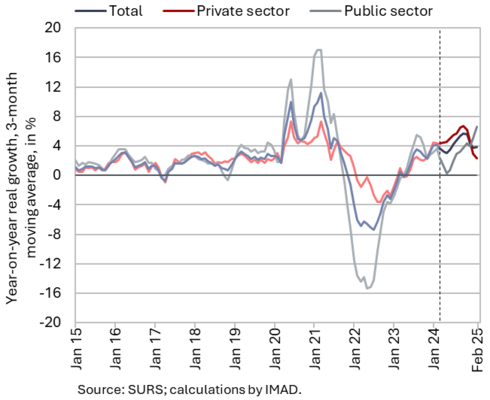
Year-on-year nominal growth of the average gross wage stood at 6.6% in February, a rate similar to that recorded in January but higher than at the end of 2024, primarily due to stronger wage growth in the public sector following the implementation of the new wage system. In the public sector, wages rose by 10.6% year-on-year in February, supported by the disbursement of the first instalment of the agreed wage increase. In the private sector, year-on-year growth continued to moderate slightly (4.4%), which, in IMAD’s assessment, may be attributed to a decline in excess demand – indicated by a declining job vacancy rate – and a smaller increase in the minimum wage at the beginning of this year compared to last year.
In real terms, the average gross wage increased by 5% in February – by 2.8% in the private sector and by 8.9% in the public sector.
Consumer prices, April 2025
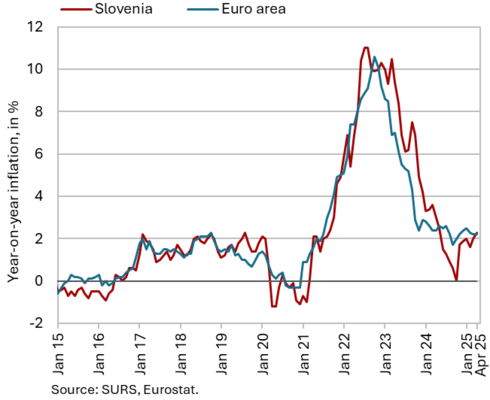
Year-on-year growth of consumer prices increased further in April, by 0.3 p.p., reaching 2.3%, the highest level since May 2024. The main contributor to higher inflation were higher prices of food and non-alcoholic beverages, which increased by 5.9% year-on-year (compared to 3.5% in March). This was the highest growth rate among all 12 CPI groups of goods and services. In addition to the monthly increase in vegetable and meat prices, a significant contributor to the higher year-on-year growth was also the lower base from April last year, when food and non-alcoholic beverage prices fell by 1% month-on-month (in April this year, they increased by 1.2% month-on-month). Inflation was also pushed up by an above-average seasonal increase in footwear prices (20% on a monthly basis), which raised the year-on-year growth in prices of semi-durable goods to 3.9% (2.2% in March); the prices of durable goods remained lower year-on-year (–0.3%). The year-on-year growth of service prices declined slightly in April, but at 3.2% (March: 3.4%), it remained relatively high. Due to lower oil product prices on global markets and the depreciation of the US dollar, oil product prices in April decreased by around 3.5% month-on-month and were about 3% lower year-on-year.
Slovenian industrial producer prices, March 2025
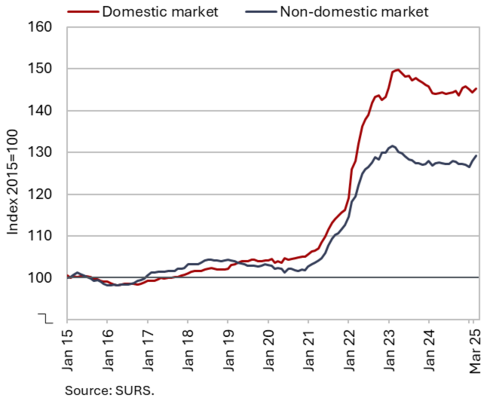
In March, year-on-year growth in Slovenian industrial producer prices rose again, reaching 1.2%. Prices on the domestic market were up by 0.9%, which is slightly less than the 1.5% increase recorded on foreign markets. The highest year-on-year price growth continues to be recorded in consumer goods, with the overall rate remaining around 3% in March. The price increase for non-durable consumer goods was relatively high (3.8%). Prices in beverage manufacturing increased by 8.4% year-on-year, while water supply prices increased by 5.4%. Prices of durable goods declined slightly, by 0.4%. For the first time since July 2023, prices of intermediate goods rose year-on-year, by 0.6%, accompanied by a similar rise in capital goods prices (0.7%). Although energy prices jumped by 5% month-on-month in March, they remained 1.8% lower year-on-year.
Loans to domestic non-banking sectors, March 2025
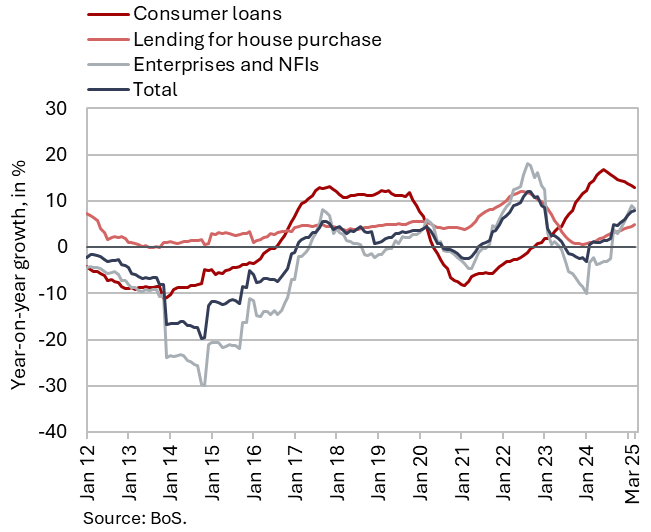
Growth in the volume of loans to domestic non-banking continued to strengthen gradually, reaching 7.9% in March. The volume of loans to households continued to increase, recording 6.5% year-on-year growth. Year-on-year growth in loans to non-financial companies remained modest (1.3%) and slowed slightly in March due to monthly deleveraging (–0.4%). Among loans to the non-bank sector, loans to non-monetary financial institutions (non-MFI) grew the fastest, increasing by nearly 70% year-on-year, although they accounted for only 7.1% of total loans to the domestic non-bank sector. The growth of deposits by the non-bank sector remained at around 3%, with the loan-to-deposit ratio remaining stable at approximately 0.70. As the ECB lowers its key interest rates, deposit interest rates are also declining, which is affecting the maturity structure of deposits somewhat negatively once again, as overnight deposits, in particular, are increasing. The share of non-performing loans remained at 1%. However, by the end of last year, the share of S2 exposures increased slightly – primarily due to growth in non-financial companies (especially in manufacturing) and to a lesser extent in households – reaching 5.2% in February, which is still relatively low.
Current account of the balance of payments, March 2025
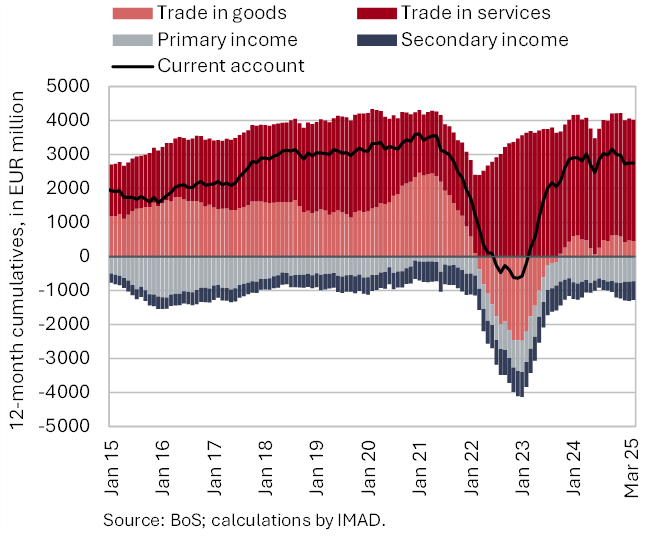
The surplus on the current account of the balance of payments was EUR 231 million lower year-on-year in the first quarter of this year, amounting to EUR 446 million. The largest contribution to the decline came from the goods trade balance (EUR 134 million). Real imports of goods increased year-on-year, while exports declined slightly. The terms of trade remained unchanged. The surplus in services was lower year-on-year, primarily due to a smaller surplus in construction services and a larger deficit in the trade of licences and patents. The higher secondary income deficit resulted mainly from increased net outflows of transfers by both the general government and the private sector to the rest of the world. The primary income deficit was lower year-on-year due to smaller net outflows from dividends and profits and higher net interest receipts from financial investments in securities. The 12-month balance of the current account of the balance of payments showed a surplus of EUR 2.8 billion in March (3.9% of estimated GDP).
Revenue (top figure) and expenditure (bottom figure) of the consolidated general government budgetary accounts, Q1 2025
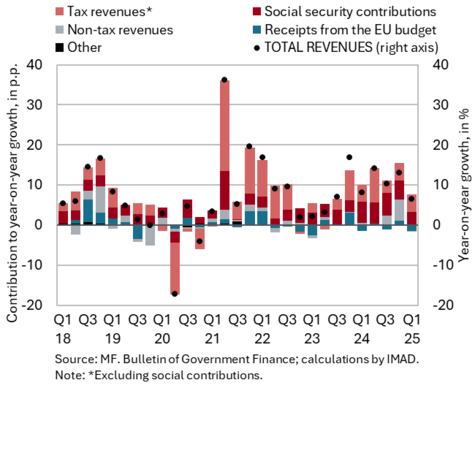

In the first quarter of this year, the deficit of the consolidated balance of public finances was higher year-on-year. It totalled EUR 567.2 million, compared to EUR 370.7 million in the same period last year. Revenue in the first quarter was 6.4% higher year-on-year. The main contributors to revenue growth were tax revenues, particularly corporate income tax revenues – driven mainly by the higher tax rate – and value added tax (VAT) revenues, which strengthened year-on-year. Social contributions made a significant contribution to revenue growth; however, this year’s growth is lower than last year, when it was boosted by the transformation of supplementary health insurance into a mandatory health contribution, although it remains relatively strong. Personal income tax revenues recorded low growth this year due to the adjustment of the income tax brackets and tax reliefs. Total receipts from the EU budget were lower year-on-year. Expenditure in the first quarter was 9.1% higher year-on-year. The bulk of the expenditure increase stemmed from interest payments and current transfers to individuals and households, driven mainly by pension expenditures and other current transfers (agricultural subsidies). Investment expenditure was slightly lower year-on-year. Year-on-year growth in expenditure on wages was relatively modest in the first quarter despite the implementation of the wage reform, mainly due to a base effect stemming from the early payment of last year’s annual holiday allowance in March.
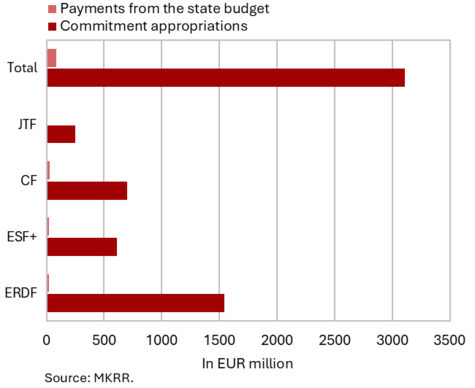
EU budget receipts, March 2025 (top figure) and absorption of 2021–2027 funds under the Cohesion policy programme (EU part) for the period 1 January 2021–31 March 2025 (bottom figure)
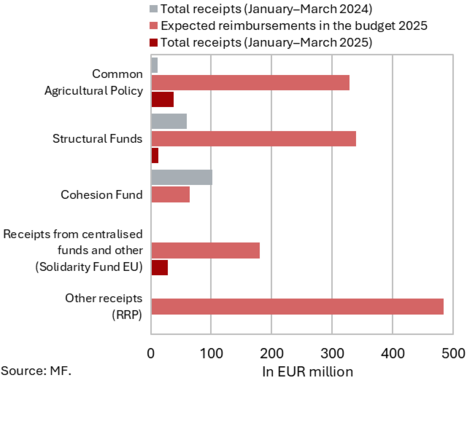
Slovenia’s net budgetary position against the EU budget was negative in the first three months of 2025 (at EUR 76.5 million). In this period, Slovenia received EUR 79.8 million from the EU budget (5.7% of receipts envisaged in the adopted state budget for 2025) and paid EUR 156.3 million into it (21.4% of planned annual payments). The bulk of receipts (46.8% of all reimbursements to the state budget, 11.4% of the planned reimbursements in 2025) came from EU budget funds received for the implementation of the Common Agricultural Policy and the Common Fisheries Policy, followed by EU funds received for the implementation of centralised and other EU programmes (34.9% of all reimbursements to the state budget, 15.5% of the planned reimbursements in 2025), the majority of which were related to the Connecting Europe Facility. Reimbursements from the structural funds amounted to 16.4% of all reimbursements (3.9% of the planned reimbursements in 2025). According to the Information on the Implementation of the RRP (March 2025), two payment requests are planned to be submitted to the European Commission this year – one in the spring and one in the autumn – with a total indicative amount of EUR 944 million. The highest payments into the EU budget came from GNI-based payments (48.4% of all payments).
According to MKRR data, under the Operational Programme for the Implementation of EU Cohesion Policy 2021–2027 (from January 2021 to the end of March 2025), payments from the state budget totalled EUR 81.7 million (EU share), representing 3% of total available funds.