Charts of the Week
Current economic trends from 27 August to 3 September 2021: GDP, electricity consumption, trade, market services and other charts
Slovenian economic activity picked up significantly in the second quarter, which also had a positive impact on the labour market. Real GDP grew by 1.9% compared to the first quarter and by as much as 16.3% year-on-year, due to a significant low base effect. As a result, GDP is only slightly below the pre-crisis level reached in the last quarter of 2019. This trend reflects stabilisation in the epidemiological situation and the consequent gradual easing of containment measures. Moreover, businesses and consumers have adapted better than expected to the restrictions imposed by the pandemic. Additional impetus came from accelerated activity in the global and euro area economies and from effective policy support measures. Activity growth in the export part of the economy, which was generally less affected by the containment measures, continued and was already above pre-crisis levels by the end of last year. Further easing of containment measures has led to a more marked recovery in the entertainment, sports, recreational and personal care services and accommodation and food service activities, although they were still well below the pre-epidemic levels. Private consumption also recovered accordingly. For the third quarter, some indicators of economic activity point to a slowdown in growth in the export part of the economy, due to difficulties in the supply of materials and lower production. This includes electricity consumption, whose growth has slowed in recent months. Preliminary data for July also point to a less favourable trend. In August, year-on-year consumer price growth remained at just under 2% and inflation continues to be largely driven by higher prices for oil products. The number of registered unemployed also fell over the summer months and was lower at the end of August this year than in the same period in 2019 and 2020.
GDP, Q2 2021
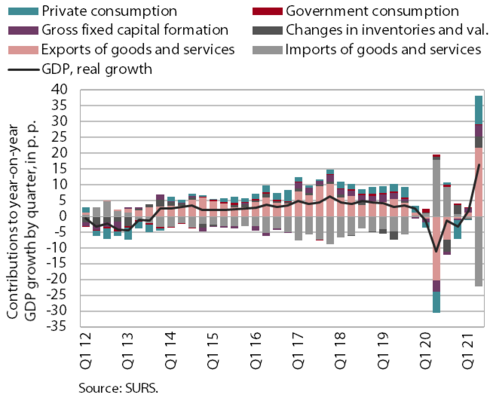
In the second quarter of 2021 GDP increased by 1.9% over the first quarter and by 16.3% year-on-year. As a result, GDP was only slightly (0.2%) behind its pre-crisis level in Q4 2019. The high year-on-year growth, which was above the EU average, was mainly a consequence of last year's low base. This development reflects an improvement in the epidemiological situation and the gradual easing of containment measures, as well as the adjustment of the economy and consumers to the changed conditions. The growth observed since the middle of last year in activities related to external trade (transportation and export-oriented manufacturing activities), which were not as affected by the containment measures, has continued. As in the case of exports and imports of goods, activity in these sectors also exceeded pre-epidemic levels. The recovery in gross fixed capital formation, especially in equipment and machinery, has continued. Further easing of containment measures has allowed the entertainment, sports, recreational and personal care services and accommodation and food service activities to recover significantly, although they have not yet reached their pre-epidemic levels. Private consumption also recovered accordingly. Imports and exports of services also grew quarter-on-quarter, but still lagged behind pre-crisis levels. Final government consumption remained higher year-on-year also in the second quarter.
Electricity consumption, August 2021
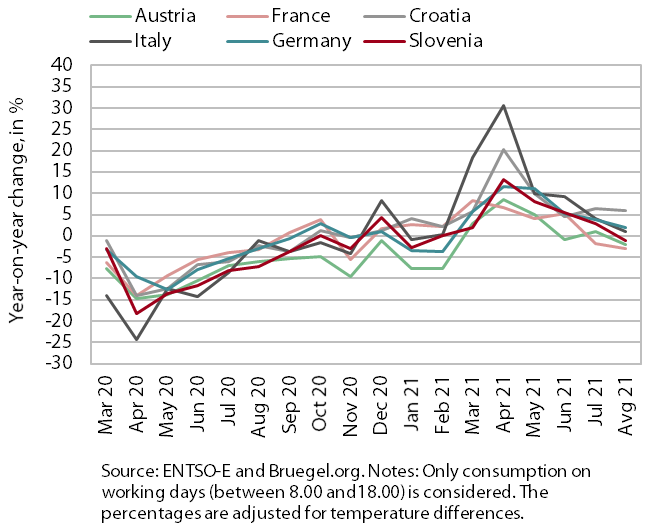
Electricity consumption in August was 1% lower year-on-year and 7% lower than in August 2019. Lower consumption may be partly due to the timing of summer holidays as well as problems with the supply of input materials and lower production. Among Slovenia's main trading partners, Austria (2%), France (5%) and Italy (2%) recorded lower consumption compared to August 2019, while consumption in Germany and Croatia remained about the same. Compared to August last year, consumption was higher in most of Slovenia’s partners (1 % in Italy, 2 % in Germany and 6% in Croatia), except in Austria and France, where it was lower (2 and 3 %, respectively).
Trade, June 2021
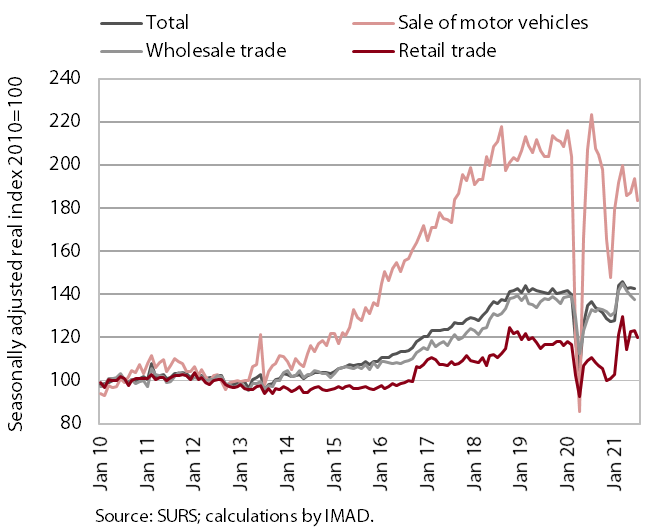
In the second quarter, turnover in trade increased year-on-year and in comparison with the previous quarter, exceeding 2019 levels; according to preliminary data, it decreased in July. Turnover increased in retail trade due to higher sales of motor fuel and non-food products, while food sales declined slightly after the strong increase in the first quarter. Although turnover in wholesale trade declined after a sharp increase in February and March, it remained at a similar level in the second quarter as in the first, while motor vehicle sales was lower despite its increase in May and June. Aside from motor fuel sales, this was the only major sector to lag behind the Q2 2019 sales. According to preliminary data, turnover in retail trade and motor vehicle sales decreased in July.
Market services, June 2021
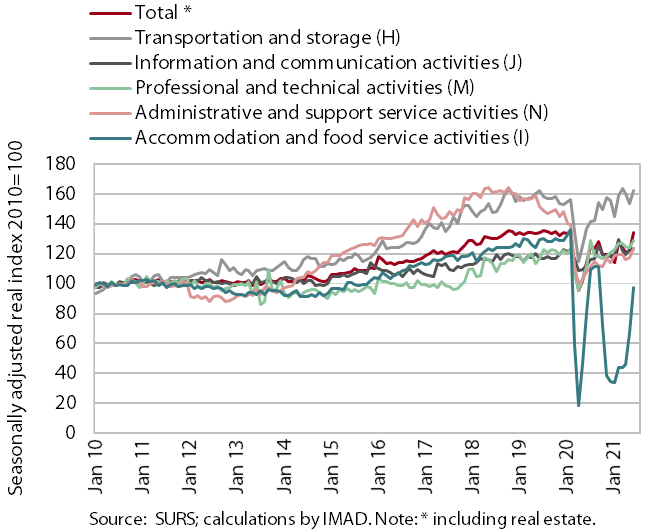
Real turnover increased further in most services in the second quarter. It rose 3.2% from the previous quarter and was 21% higher than a year ago due to the low base. After hotels and restaurants opened, the highest increase in turnover was recorded in the accommodation and food service activities. Turnover also increased in transportation, with storage activity being the key contributor to the continued growth. Turnover in professional and technical activities stagnated, while turnover growth in administrative and support service activities slowed, despite strong growth in travel agencies. Only information and communication activities saw a decline in turnover, which was due to lower turnover in computer services in the domestic market despite the higher export turnover. Year-on-year turnover growth in the second quarter was positive in all market services due to last year’s low base. However, turnover was well below pre-epidemic levels, particularly in accommodation and food service activities and travel agencies (more than 40% and 80%, respectively).
Consumer prices, August 2021
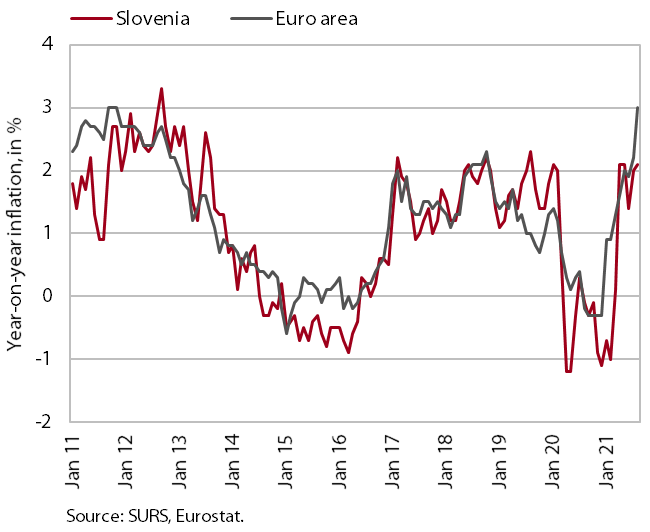
In August, consumer price growth remained close to 2%. Inflation was still mostly fuelled by higher oil product prices (1.2 p.p.), which were more than a quarter higher year-on-year. Against a backdrop of higher demand and supply-side constraints, non-energy industrial goods prices also rose year-on-year, namely prices of durable goods by 2.6% and prices of semi-durable goods by 1.3%. Year-on-year growth in service prices strengthened somewhat in August, but still remained moderate (0.8%). Food prices remained lower year-on-year, as well as prices of package holidays due to lower prices for package international holidays (by 13.3%). Prices of package domestic holidays rose by almost 5% due to higher demand related to the redemption of vouchers, which also led to stronger price increases in the restaurants and hotels group, where prices rose by almost 4% year-on-year.
Active and inactive population, Q2 2021
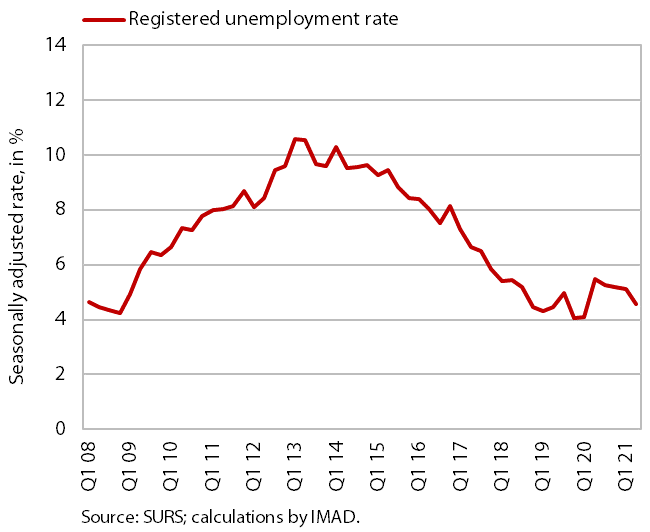
According to the survey data, labour market conditions improved significantly in the second quarter. The number of unemployed fell by 9.7% compared to the previous quarter (according to seasonally adjusted data), and by 17% compared to the second quarter of last year (according to original data). In the second quarter, the survey unemployment rate decreased year-on-year by 0.9 p.p., to 4.3%.
As demand for labour increases, the registered unemployment also continues to decline (according to ESS data). At the end of August, 69,292 people were unemployed, 1.9 % fewer than at the end of July and 21.4 % fewer than a year earlier. The number of unemployed people decreased also compared to the end of August 2019 (by 3.1%).