Charts of the Week
Current economic trends from 26 July to 25 August 2021: economic sentiment, traffic of electronically tolled vehicles, electricity consumption, electricity consumption by consumption group and other charts
Slovenian economic activity increased in most sectors in the second quarter as the epidemiological situation improved and the containment measures were gradually eased, which also had a positive impact on the labour market. As favourable trends in the export part of the economy continued, the situation also improved in trade and market services. The only exception is construction, where activity in all segments declined somewhat in the second quarter compared to the first quarter. The stock of contracts in construction has increased in recent months, suggesting an improvement in construction activity in the third quarter. Further broad-based growth in economic activity is also indicated by July data on freight traffic and electricity consumption, as well as August data on fiscal certification of invoices and confidence in the economy. Year-on-year consumer price growth increased in July on the back of high energy prices, as did growth in Slovenian industrial producer prices, to which commodity prices contributed the most. The unemployment rate continued to decline in July. At the end of the month, there were 21% fewer unemployed than a year ago and 1.7% fewer than in the same period of 2019.
Economic sentiment, August 2021
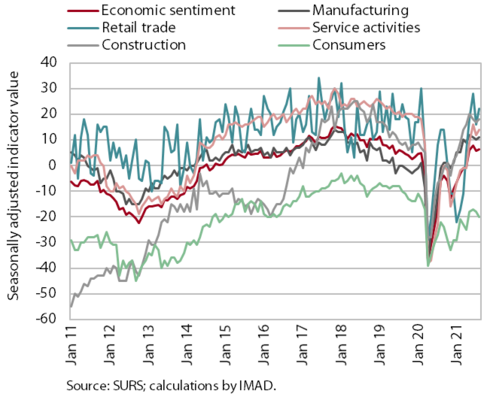
The economic sentiment indicator improved in August. After a decline in July, confidence indicator rose on a monthly basis in all sectors of the economy. The indicator value rose the most in retail trade, mainly due to a strong increase in the volume of stocks, while the expected sales and sales indicators decreased slightly. The increase in indicator values for other activities was modest. Confidence among consumers, who are particularly concerned about the future economic situation, deteriorated again. All confidence indicators improved significantly compared to the same period last year. However, compared to the same period in 2019, most remained at similar levels.
Traffic of electronically tolled vehicles on Slovenian motorways, July 2021
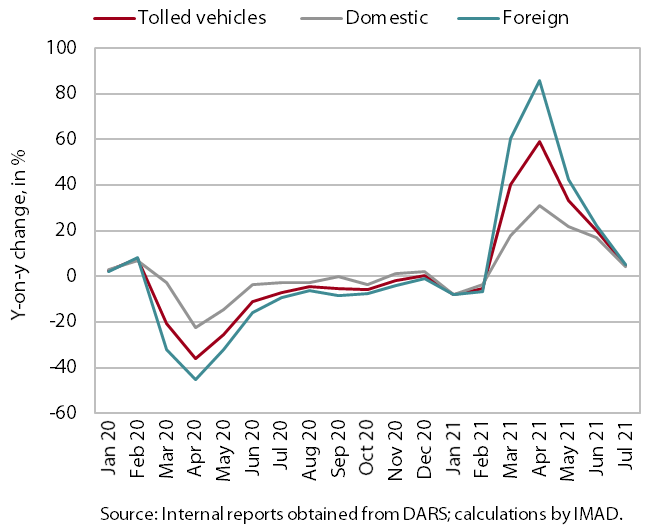
Freight traffic on Slovenian motorways in July was 5% higher year-on-year and close to the level of the same period in 2019. Last July, after the first wave of the epidemic, traffic was quite close to the levels in the same period before the crisis. As a result, it was only slightly higher this July than the same month last year. Compared to July 2019, the volume of freight traffic was 2% lower, partly due to one working day less (domestic vehicle traffic was 1% higher, while foreign vehicle traffic was 5% lower). After adjusting the data for working days, freight traffic was 2% higher than in July of the pre-epidemic year 2019.
Electricity consumption, July 2021
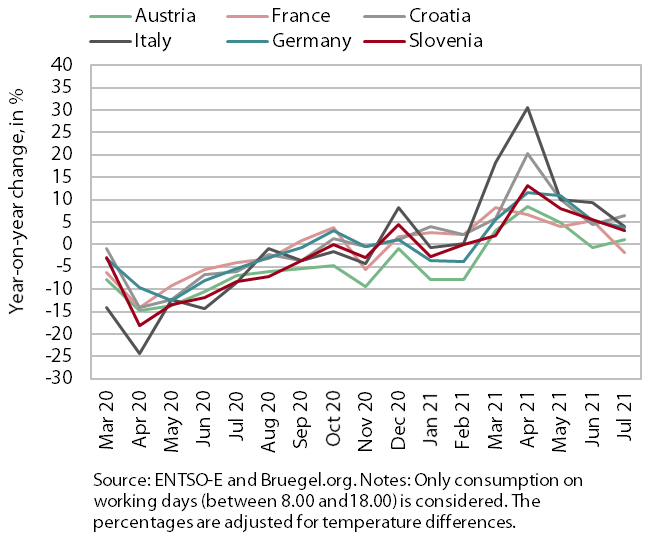
Electricity consumption in July was 3% higher year-on-year but 4% lower than in July 2019. The gap with the same period in 2019 narrowed compared to the previous month (in June, it was 6%), probably due to the gradual increase in activity in the tourism sector. Among Slovenia's main trading partners, France and Italy recorded lower consumption compared to July 2019 (namely 1% and 4%, respectively), while consumption in the other countries remained about the same. Compared to July last year, consumption was higher in most of Slovenia’s partners (4% in Italy and Germany, 7% in Croatia and 1% in Austria), except in France, where it was 2% lower.
Electricity consumption by consumption group, July 2021
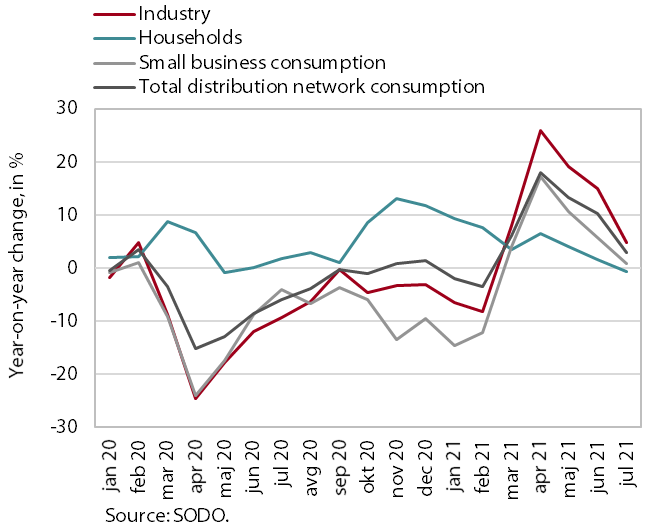
After higher consumption in June, industrial electricity consumption was lower again in July than in the same period in 2019, and the gap with that period for small business electricity consumption was about the same as in June. Industrial electricity consumption was 4.9% lower (1.2% higher in June), which could be due to component supply disruptions experienced by some companies and lower production. Small business electricity consumption was 3.3% lower (3.6% lower in June) while household consumption was 1.3% higher. Industrial electricity consumption was 4.8% higher in July year-on-year and small business electricity consumption was 0.8% higher. This increase was much smaller than in previous months, when the high year-on-year growth was mainly due to a low base last year. Household consumption was about the same as in the same period last year (-0.7 %).
Fiscal verification of invoices
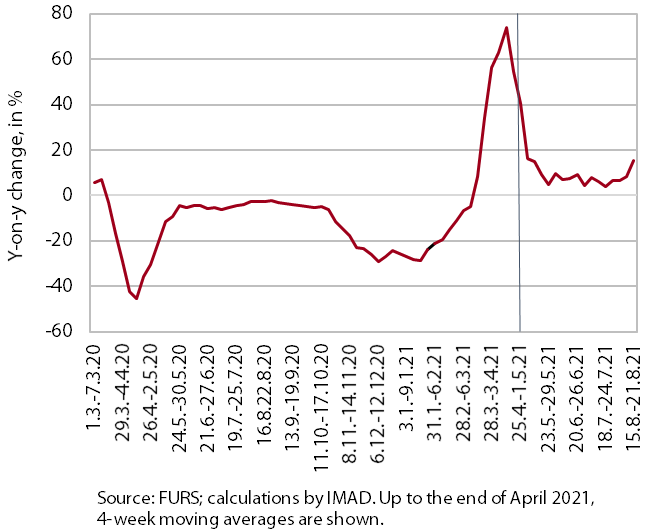
According to data on fiscal verification of invoices, total turnover in the first three weeks of August was 10% higher year-on-year and 7% higher than in the same period of 2019. The positive trend in trade continued. Turnover was around 7% higher year-on-year and compared to 2019. In most mainly tourism-related sectors, as well as arts, entertainment and recreation, sales growth was even higher year-on-year (due to the low base). In addition to a larger number of foreign tourists, the increased turnover was also influenced by the redemption of vouchers introduced last year and this year. Turnover in certain services (accommodation and food service activities, sports, cultural activities) was also higher than in the same period in 2019, while turnover in other services (casinos and travel agencies) fell significantly short of this level, by about one third.
Trade, May 2021
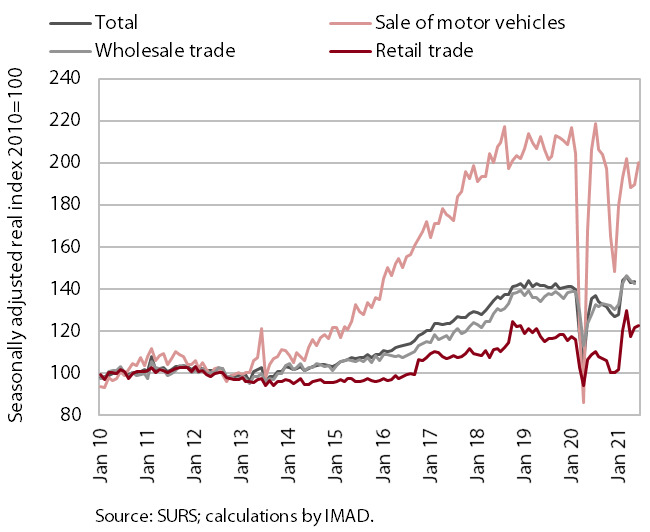
Turnover in trade increased in May; according to preliminary data, growth continued in June. After falling in April, turnover rebounded in May, reflecting the easing of measures that were tightened in April. Turnover increased in retail trade (due to higher sales of motor fuel and non-food products) and in motor vehicle sales (mainly due to higher sales to individuals). Turnover in wholesale trade fell slightly, but exceeded the May 2020 level by almost a fifth due to a strong increase in the first quarter. Compared to May 2019, it was 7% higher. According to preliminary data, turnover growth in retail trade and motor vehicle sales continued in June.
Market services, May 2021
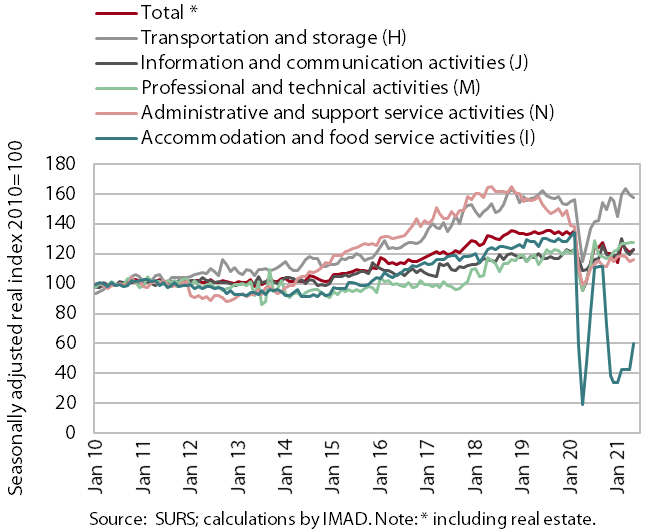
In May, real turnover increased in most market services. It rose 2% from the previous month and 20.3% from a year earlier, reflecting the low base. With hotels and restaurants opening, it increased the most in the accommodation and food service activities. Turnover in information and communication activities also rebounded due to growth in telecommunications and computer services. As turnover in travel agency activities stopped declining, turnover in administrative and support service activities increased again. Turnover in professional and technical activities remained at the same level as the previous month. Only transportation saw a decline in turnover, primarily in storage activities. Year-on-year turnover growth in May was positive in all market services due to last year’s low base. However, turnover was well below pre-epidemic levels, particularly in accommodation and food services and travel agencies (more than 50% and 80% respectively).
Current account of the balance of payments, June 2021
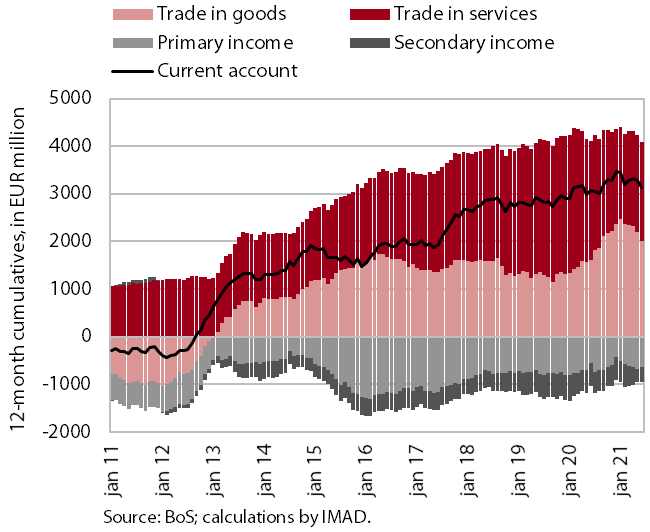
The current account surplus fell again year-on-year in the second quarter, and the terms of trade deteriorated significantly for the first time in several years. The lower current account surplus is mainly due to the lower trade surplus, which is also related to higher prices of energy and other primary commodities, which have the largest impact on import price growth. Import prices were 8.6% higher year-on-year (while export prices were 2.9% higher). The terms of trade deteriorated by 5.2%, the most since 2010. Net outflows of primary income were higher year-on-year in the second quarter, mainly due to higher payments of dividends and profits to foreign investors. Net outflows of secondary income were lower year-on-year, mainly due to more government funds received from the EU budget. Trade in services rebounded in the second quarter with the easing of containment measures after more than a year. The surplus in trade in services was higher year-on-year, mostly due to a larger surplus in transportation and other business services. The 12-month current account surplus on the balance of payments stood at EUR 3.1 billion in June (6.5% of estimated GDP).
Exports and imports of goods, June 2021
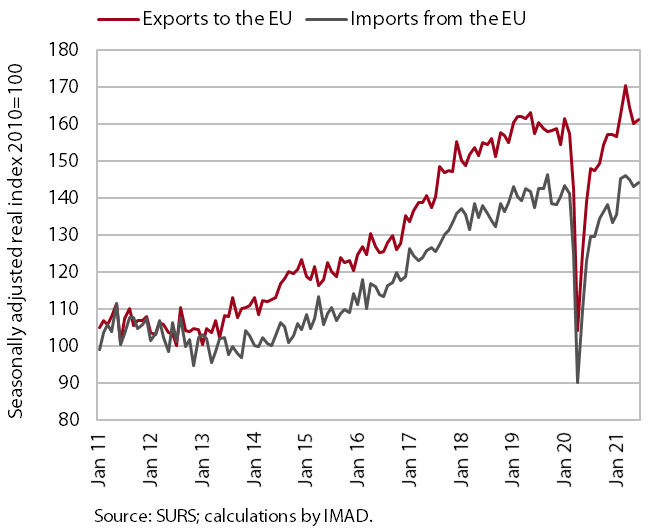
Trade in goods remained at a similar level in the second quarter as in the previous quarter, and thus continued to be above the pre-epidemic level. At the same time, stronger monthly fluctuations were observed, mainly due to changes in containment measures in Slovenia and among Slovenia’s main trading partners. Compared to the previous quarter, real exports of goods to EU Member States fell slightly in the second quarter (by 0.8%, seasonally adjusted), which we believe was mainly due to lower exports of motor vehicles caused by supply chain disruptions and partly to a slowdown in the industrial recovery in Slovenia’s main trading partners. Exports of most product groups exceeded comparable 2019 levels, while exports of vehicles (cars and motor vehicle parts and accessories) and primary products (especially re-exports of oil and oil products) remain noticeably lower than before the epidemic. Imports of goods increased (by 1.2%, seasonally adjusted), mainly of intermediate goods. The large year-on-year increase was mainly due to very low activity in the second quarter of last year, while imports also exceeded the level of the same period in 2019. Export expectations remained favourable in the summer months, which is related to the expected continuation of activity growth among Slovenia’s main trading partners.
Production volume in manufacturing, June 2021
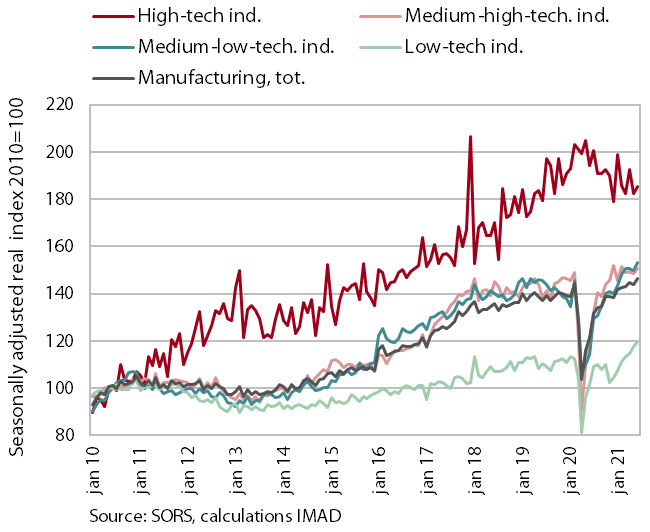
Manufacturing output continued to rise in the second quarter. Compared to the previous quarter, activity increased in medium-high, medium-low and low-technology industries, while it contracted slightly in high-technology industries. Compared with the same period last year, production volume in manufacturing rose sharply in most sectors in the second quarter, mainly due to a low base. High-technology industries, where production volumes remained relatively high even after the outbreak of the pandemic last year, saw a year-on-year decline. Compared to the same period in 2019, growth in medium- and low-technology industries was much more moderate in the second quarter. Production volume in the automotive industry, the manufacture of metals, the manufacture of other non-metallic mineral products, and the leather industry recorded a decrease compared to the same period in 2019, while production volume in high-technology industries increased.
Construction, June 2021
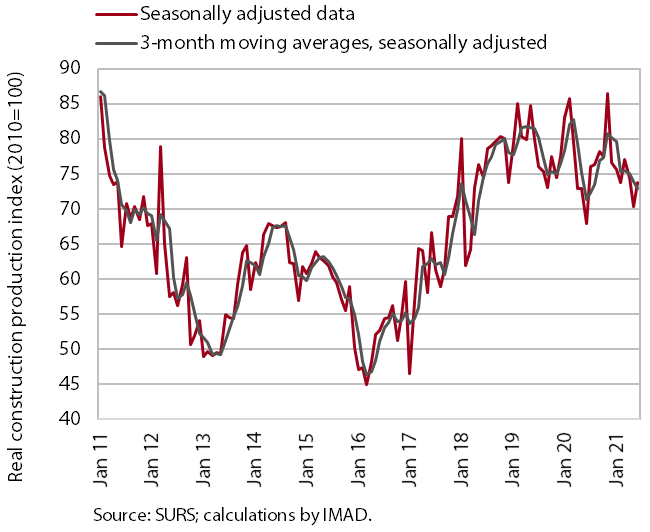
Activity in construction declined in the second quarter. The value of construction output fell in all segments, particularly in the construction of non-residential buildings. We estimate that the lower value of construction output is related to supply constraints and material prices, as firms reported the historically highest values for these two factors, which negatively affected construction output in the second quarter. Compared to the second quarter of last year, overall construction activity was higher, although it declined in the non-residential buildings sector.
The stock of contracts in construction has strengthened in recent months on the back of gains in civil-engineering and specialised construction (there was no strengthening in building construction), pointing to more favourable conditions in construction.
Labour market, June–July 2021
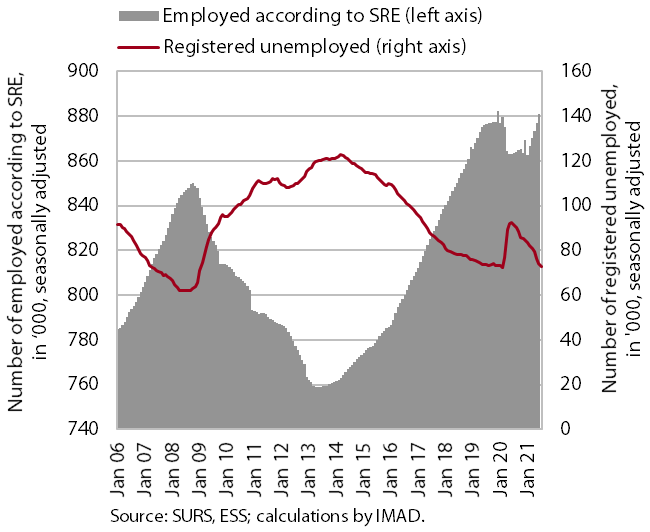
The number of unemployed continued to fall in July. This is due to the easing of containment measures and the resulting increase in demand for labour. At the end of July, 70,655 people were unemployed, 0.6 % fewer than at the end of June and 21% fewer than a year earlier. The number of unemployed decreased also compared to the end of July 2019 (by 1.7%). The number of employed people was 2.1 % higher in June than in the same month last year, mainly due to the base effect (sharp decline in the spring months of last year). The highest increase in employment was recorded in health and social work and construction, while accommodation and food services and arts, entertainment and recreation recorded a decrease compared to the same month last year.
Wages, June 2021
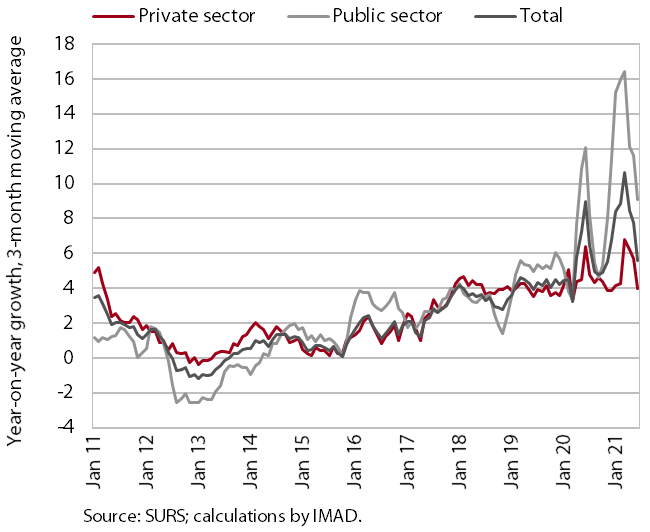
Year-on-year wage growth in June was about the same in the public and private sectors, at 7.7% overall. In the public sector, it was 8.3%, significantly lower than in May, reflecting the end of the epidemic in mid-June, when the bonuses (bonus for hazardous working conditions and additional workload, as well as the bonus for work in crisis conditions in accordance with the collective agreement) stopped. In the private sector, average wages were 7.5% higher in June year-on-year, mainly due to the change in the wage calculation methodology due to the intervention measures. The high wage growth is also driven by increasing labour shortage.
Consumer prices, July 2021
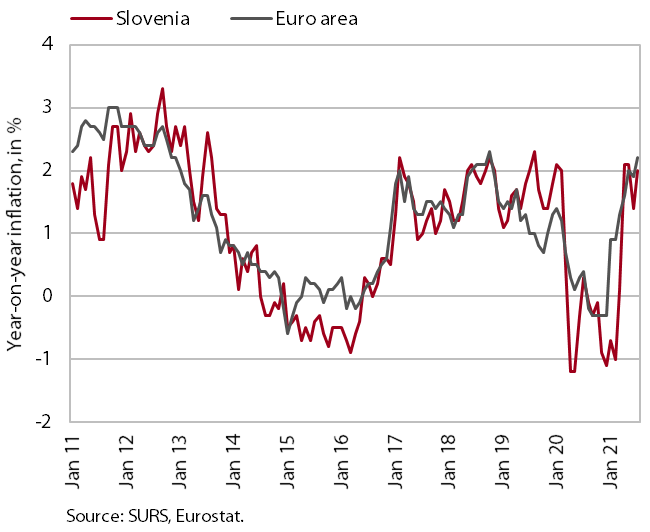
Consumer price growth strengthened in July to 2%. Given the high oil prices in global markets, the contribution of energy increased to 1.2 p.p. Semi-durable goods price growth also strengthened significantly (to 2.7 %), which we believe is due to price developments in the clothing and footwear group, which contributed 0.3 p.p. to inflation. After declining in recent months, prices of services were slightly higher year-on-year in July, driven by rising prices in the restaurants and hotels group. Airline ticket prices were also higher year-on-year due to higher seasonal demand. Growth of durable goods prices also strengthened slightly (1.8%) due to a slower decline in the prices of used cars (1.2%), while motorcycle and bicycle prices rose significantly (by about one tenth). Food prices remained lower year-on-year.
Slovenian industrial producer prices, July 2021
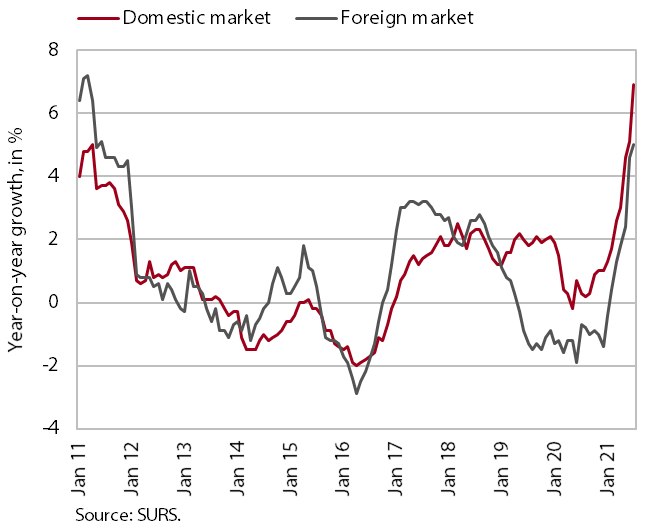
Slovenian industrial producer price growth strengthened to 6.2% year-on-year in July. Price growth in the domestic and euro area markets continues to strengthen, but after a modest increase in recent months, it also rose significantly in non-euro area markets in July (5%). The main contributors to the overall growth of Slovenian producer prices are still stronger price growth in the group of commodities (already more than a tenth higher year-on-year in July), as well as in the group of capital goods (5.3%). Growth in consumer goods price was still relatively moderate in July (1.3%), but has been gradually rising.