Charts of the Week
Current economic trends from 23 to 30 November 2020: gross domestic product, economic sentiment, electricity consumption, traffic of electronically tolled vehicles and other charts
After a sharp decline in the second quarter, real GDP increased notably in the third (12.4%) with the relaxation of containment measures and its y-o-y decline was significantly smaller (–2.6%, compared with –13% in the second quarter). The increase was mainly due to the recovery of activity in the export part of the economy, but also some service activities. For the last quarter of the year, economic indicators suggest a renewed, albeit smaller, decline in economic activity amid the second wave of the epidemic. Economic sentiment fell in October. In November the fall deepened further but remained above the levels of the spring months. The y-o-y falls in electricity consumption and freight traffic on Slovenian motorways also remained significantly lower than in the spring. Unemployment stayed similar to that in the previous two months.
Gross domestic product, Q3 2020
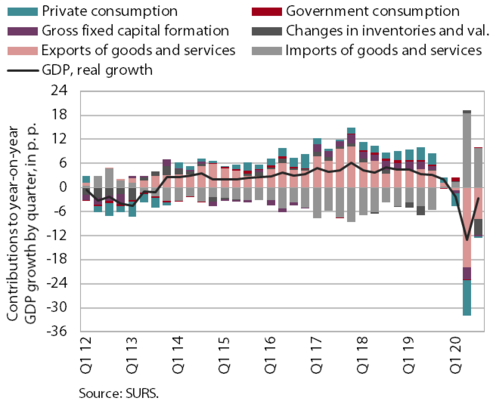
In the third quarter, real GDP recovered more than expected while its y-o-y fall decreased (– 2.6%; in Q2: –13.0%). The smaller y-o-y decline in activity was mainly attributable to a fast recovery in the export part of the economy and some service activities due to the relaxation of containment measures amid a temporary improvement in the epidemiological situation in the summer months. Y- o-y declines in exports and imports decreased with a rebound of activity in main trading partners. Stronger activity was also recorded in service activities related to domestic consumption and tourism, but they were recovering more slowly due to the retention of some containment measures and a strong fall in foreign tourist arrivals. The loosening of containment measures also had a favourable impact on the q-o-q growth of household consumption, but it remained slightly lower y-o-y, also due to a high level of precautionary saving. Investment in machinery and equipment recovered strongly at the quarterly level, while construction investment was even higher than one year earlier. The total level of gross investment remained highly negative y-o-y mainly due to a marked fall in inventories. Among consumption aggregates, only final government consumption was up y-o-y.
Economic sentiment, November 2020
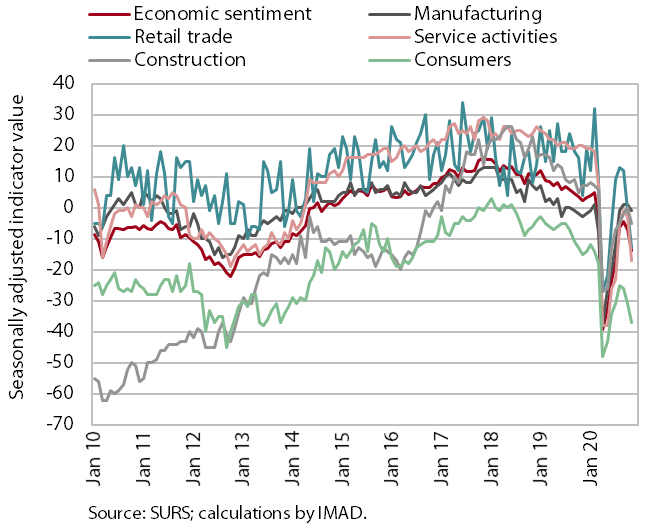
Economic sentiment deteriorated notably in November but remained above the spring months’ levels. Due to a renewed spread of the epidemic and the adoption of containment measures, the economic sentiment indicator fell in October after several months of improvement. In November the fall deepened with a decline in confidence in all sectors and among consumers. It fell most notably in services, particularly due to significantly lower expectations about demand, and the least in manufacturing. In manufacturing, business confidence was higher y-o-y, despite lower expectations about production than in October. Expectations about exports also remained higher y- o-y.
Electricity consumption
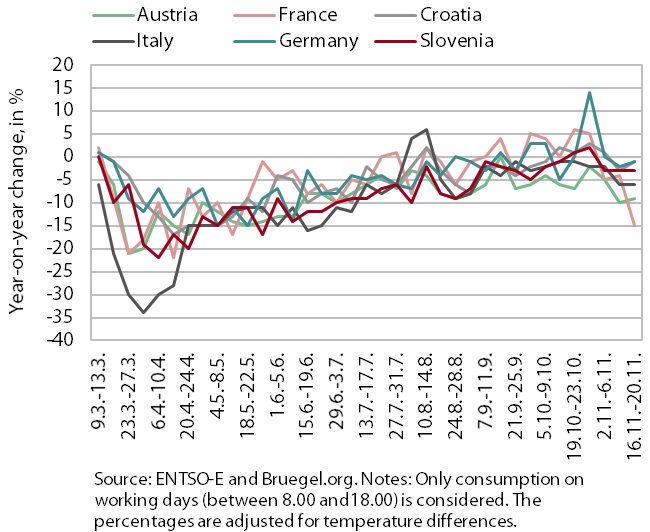
The y-o-y fall in weekly electricity consumption in the third week of November remained significantly smaller than in the spring, despite the tightening of containment measures. In the third week of November, electricity consumption was, as in the previous two weeks, 3% lower y-o-y (in the middle of April, around 20% lower). In the majority of main trading partners, the y-o-y decline in the third week of November remained roughly unchanged relative to the previous week. The decline in Austria was –9% and in Italy –6%. In Germany and Croatia, it was smaller (around –1%). A pronounced change was seen only in France (–15%; one week earlier: –4%).
Traffic of electronically tolled vehicles on Slovenian motorways, November 2020
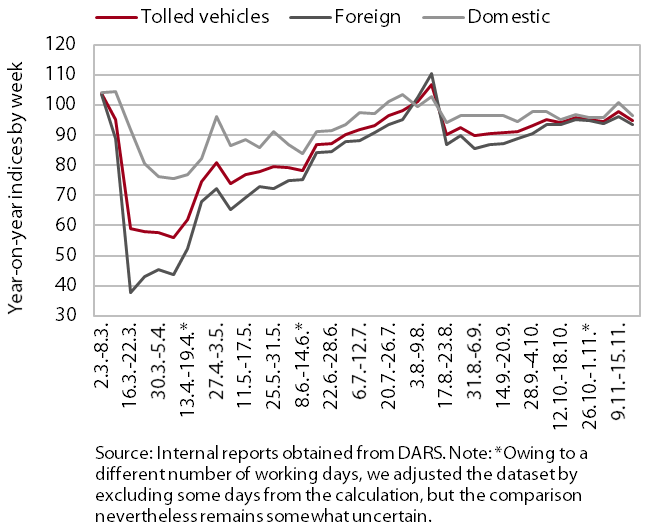
Freight traffic on Slovenian motorways in the second half of November was somewhat lower than before the first wave of the epidemic. After already reaching pre-epidemic levels in mid-August, it fell slightly and then approached last year’s level again in October. In the week between 16 and 22 November, it lagged behind last year’s level by 5%, by 6% in foreign and by 3% in domestic vehicles. So far, freight traffic has not been significantly affected by restrictions in the second wave of the epidemic related to trade and accommodation and food service activities, as these activities are more dependent on local than motorway transport supply and as business operations have not been completely halted (online sales and food delivery are still possible).
Registered unemployment, November 2020
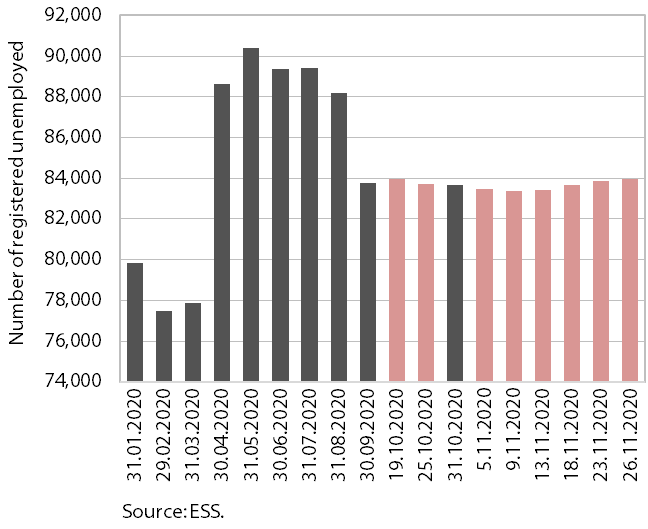
At the end of November, registered unemployment remained at almost the same level as in the previous two months, despite the renewed restrictions on business operations since mid-October. Following the strong growth in the first wave of the epidemic, the number of registered unemployed persons has been gradually falling since mid-year after the adoption of intervention job retention measures and the lifting of restrictions. Since mid-October, when the second wave of the epidemic was declared, the number has maintained a similar level, which, amid a partial adaptation of businesses and consumers to different ways of operation, is to a great extent due to the extension of intervention measures. According to ESS unofficial (daily) data, 83,966 persons were unemployed on 26 November, which is 0.4% more than at the end of October and around 16% more than in the same period last year.
Active and inactive population, Q3 2020
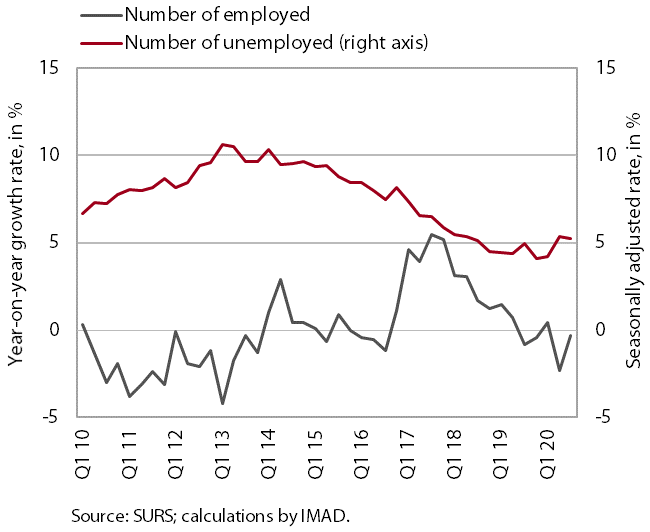
According to the survey data, labour market conditions did not deteriorate in the third quarter compared with the second. The number of employed persons was higher y-o-y, particularly of those in paid employment (1.8%). The volume of student work, however, remained significantly lower y-o-y (–21.2%), indicating that young people were the most affected in this crisis. The number of unemployed persons remained almost unchanged at the quarterly level and 8.2% higher year on year. The ILO unemployment rate remained similar to that in the second quarter. Year on year, it was somewhat higher (5.1%).
Consumer prices, November 2020
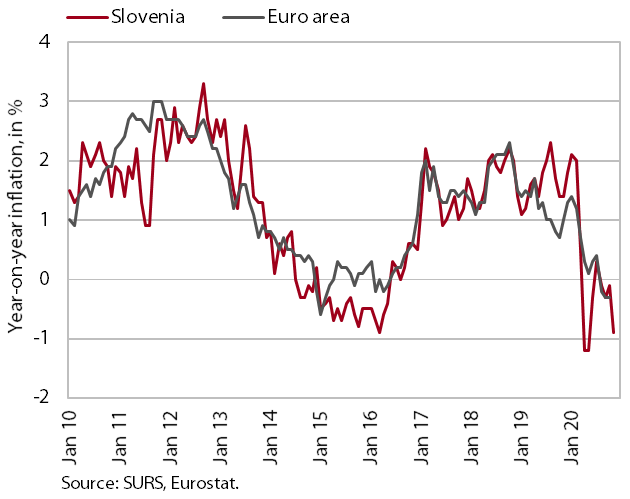
The y-o-y fall in consumer prices deepened significantly in November (–0.9%). It was still largely due to around a fifth lower prices of oil products. After October's slowdown, the fall in semi-durable goods prices strengthened significantly again (with a y-o-y decline of around 5%, the most in ten years). Clothing and food prices also fell, which we estimate is a consequence of a different way of data collection and lower demand due to the tightening of measures to contain the epidemic. Reflecting a good harvest, y-o-y growth in food prices slowed significantly relative to previous months. Growth in prices of services remained moderate (at around 1%).