Charts of the Week
Current economic trends from 14 to 18 December 2020: electricity consumption, electricity consumption by consumption group, traffic of electronically tolled vehicles, labour market and other charts
In the first half of December, the impact of the second wave of the epidemic and the reinstatement of containment measures on economic activity remained smaller than in the spring. The year-on-year declines in electricity consumption and freight traffic on Slovenian motorways were significantly smaller than during the first wave of the epidemic. The renewed containment measures had the greatest negative impact on the service sector. In November the year-on-year decline in electricity consumption by small business consumers (including trade and services) deepened more than that in industry. In November the number of employed persons also fell more year on year in some service activities. The number of unemployed started to increase slightly in December, but a larger increase is being prevented by intervention job retention measures. The thus far smaller increase during the second wave of the epidemic is also related to a smaller slowdown in economic activity than during the first wave.
Electricity consumption, December 2020
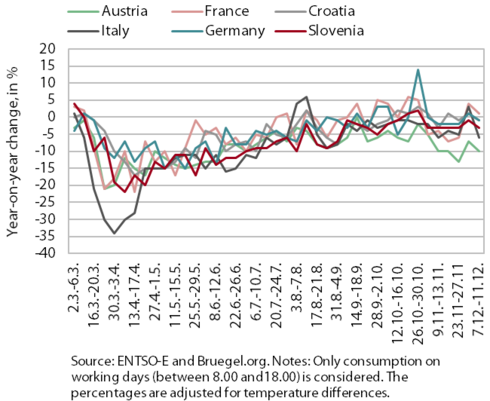
The year-on-year fall in weekly electricity consumption in the second week of December remained significantly smaller than in the spring. Electricity consumption was down 3% year on year (at the end of April and the beginning of May around 15%). The smaller decline than in the spring was primarily a consequence of a smaller fall in industrial consumption, which accounts for the largest share of total electricity consumption. Among our main trading partners, the year-on-year fall in consumption was greatest in Austria (10%), as has been the case for several weeks. Italy also had lower consumption than last year (by 6%), while consumption in Germany, France and Croatia was roughly on par with last year.
Electricity consumption by consumption group, November 2020
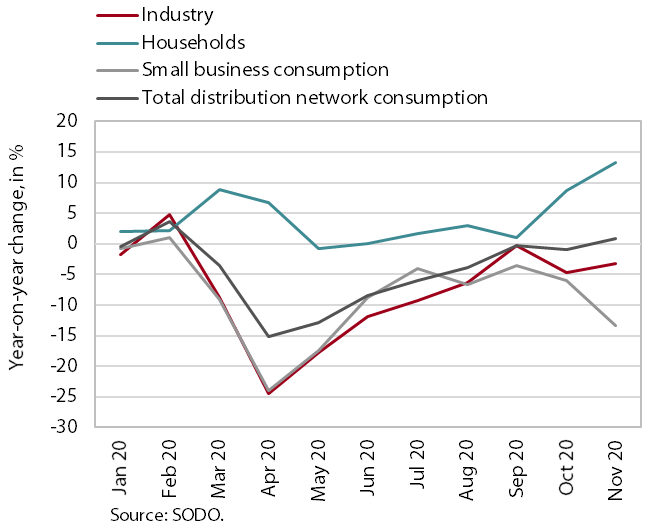
Data on electricity consumption by consumption group confirm the significantly smaller year-on-year decline in industrial consumption in the second wave of the epidemic than in the spring. In November, industrial electricity consumption was 3.3% lower year on year (in October, 4.4%). In the spring, the decline was more than 20%. A considerable renewed deepening of the decline was recorded for small business consumers, which also include trade and service activities. Small business consumption had been 5% lower on average year on year over the summer, while in November the decline deepened to 13.4% (compared with 20% in the spring). Household electricity consumption was 13.2% higher year on year, as people have mostly stayed at home due to the epidemic.
Traffic of electronically tolled vehicles on Slovenian motorways, December 2020
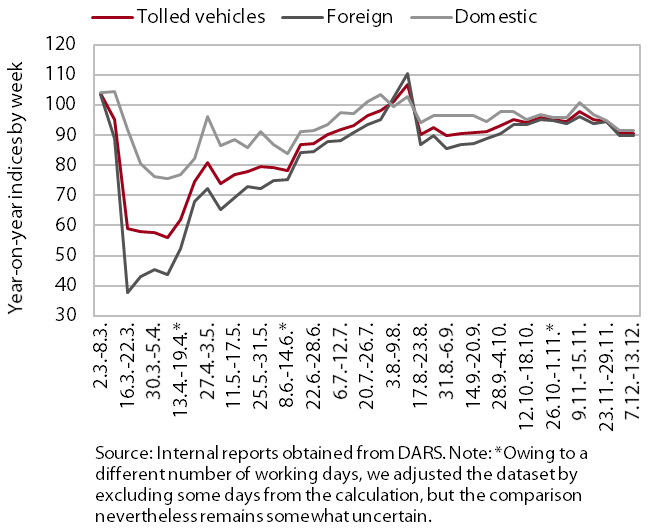
In the fist half of December, freight traffic on Slovenian motorways again fell slightly more below the pre-epidemic level, which can be largely attributed to snow. In the week between 7 and 13 December, it was, as in the previous week, 9% lower than a year earlier, similarly for both foreign and domestic hauliers. The deterioration from November was not so much due to the impact of restrictions in service activities in the second wave of the epidemic, but rather to worse weather and driving conditions. In the first two weeks of December, traffic volume was mainly lower due to snow and thus lower traffic fluidity in Slovenia and some neighbouring countries.
Labour market, October – December 2020
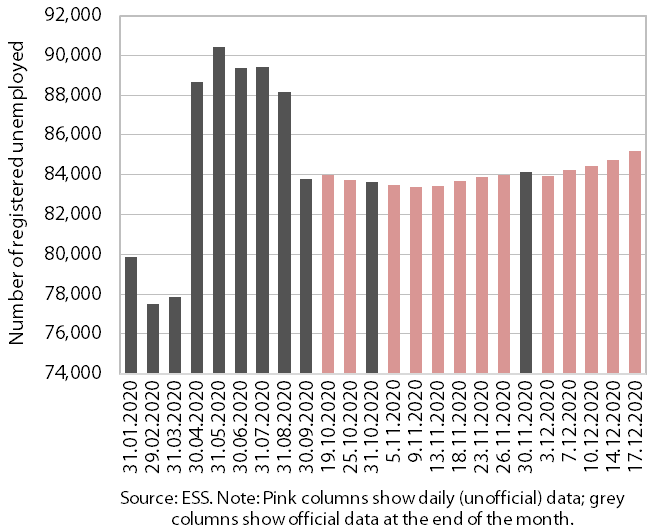
The number of registered unemployed increased somewhat by mid-December, after maintaining a similar level in the last three months. According to ESS unofficial (daily) data, 85,203 persons were unemployed on 17 December, which is 1.3% more than at the end of November and around 13% more than in the same period last year. A larger increase in unemployment is, in addition to the partial adaptation of businesses and consumers to changes in the way of operation, largely due to the extension of intervention measures. The smaller increase than in the spring months is also due to a smaller deceleration of economic activity than during the first wave. The number of employed persons was down 1.4% year on year in October, which is the same as in September. Activities with the largest declines (11.1%, 8.8% and 3.4% respectively) remain administrative and support service activities, accommodation and food service activities and manufacturing.
Wages, October 2020
The year-on-year growth of the average gross wage in October was at 4.6%; it was significantly affected by the payment of crisis allowances and the inclusion of employed persons into intervention job retention schemes. In the private sector, growth has slowed significantly since April, when it increased significantly due to the impact of the methodology for the collection of earning statistics, which reflected the placement of a large number of people on temporary layoff. In the public sector, wage growth slowed in the middle of the year when the allowances (the extraordinary payment of allowances for hazardous working conditions and additional workloads, and the payment of the bonus for work in crisis conditions in accordance with the collective agreement) were no longer paid. Since mid-October, when the second wave of the epidemic was declared, it has risen somewhat due to the renewed payment of allowances (albeit in a smaller amount than during the first wave).
Construction, October 2020
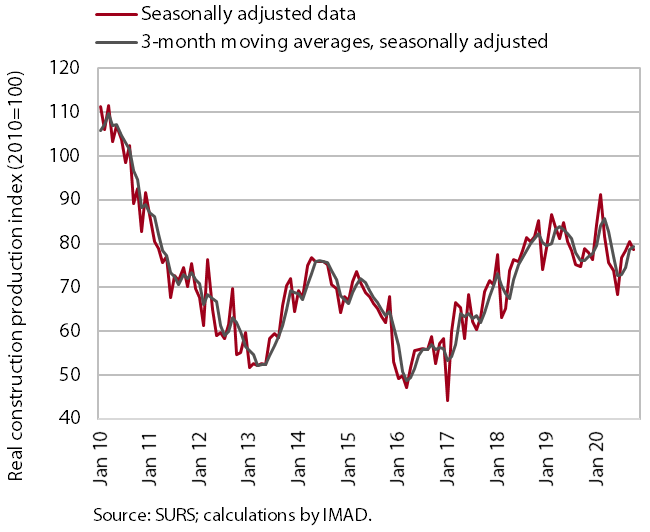
After strengthening in the third quarter, construction activity declined slightly in October. The value of construction output declined by 2%, but it was still significantly higher than in the spring months. Compared with 2018 and 2019, construction activity has been significantly lower in the last months in non-residential buildings, slightly higher in civil-engineering works and considerably higher in residential buildings (where data for the last months are less reliable).
Short-term prospects remain favourable for civil-engineering works and residential buildings, while they look worse for the construction of non-residential buildings. The stock of contracts in the construction of civil-engineering works has increased by 23% in the last year; in the construction of non-residential buildings it has declined by 11%. In the last half of 2020, the total floor area of residential buildings planned by issued building permits was 14% higher year on year.
The balance of payments, October 2020
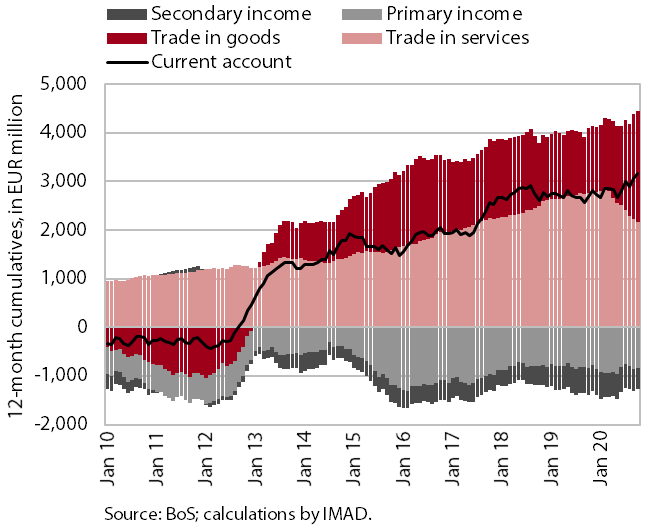
In the current account, the measures to contain the epidemic were mainly reflected in the segment of goods and services trade. The current account surplus, which in October increased again, was the highest thus far. It totalled EUR 3.2 billion in the last 12-month period (6.9 % of estimated GDP). The year-on-year higher surplus was mainly underpinned by a higher surplus in trade in goods – a larger real decline in imports than exports. The terms of trade also improved. The surplus in services trade dropped further, mostly due to a decline in the surplus in travel, while the surplus in trade in services with higher value added (telecommunications, computer and information services and research and development) increased. The current account surplus also strengthened due to lower net outflows of secondary income (mainly due to lower VAT-based contributions to the EU budget and lower payments of taxes and contributions abroad). Net outfows of primary income remained at a similar level. In the structure, there was an increase in net outflows of labour and capital income and Slovenia received higher subsidies for agricultural and fisheries policy.