Charts of the Week
Charts of the week from 27 December 2022 to 6 January 2023: consumer prices, bond, number of registered unemployed and other charts
Inflation stood at 10.3% at the end of last year. It was mostly marked by the year-on-year increase in food and non-alcoholic beverage prices. Yields to maturity of euro area government bonds also increased in the last quarter of 2022. Based on seasonally adjusted data, the monthly decline in the number of unemployed was slightly larger in December than in the previous months and year-on-year, the number of unemployed was almost one-fifth lower. The number of long-term unemployed been declining for more than one and a half years and unemployed over 50 has is also declining. Gas and electricity consumption was again lower year-on-year in December amid warm weather and the adjustment of production to high energy prices. In October, turnover in trade and marketing services fell in real terms, while November showed signs of an increase in trade. Amid high price growth, the value of fiscally verified invoices in mid-December was a good tenth higher year-on-year in nominal terms. This was mainly due to higher growth in trade, while accommodation and food service activities also made an important contribution due to the strong low base effect from 2021, when strict containment measures were in place. Trade in goods with EU countries continued to decline in November and export orders remained low amid high uncertainty in the international environment.
Consumer prices, December 2022
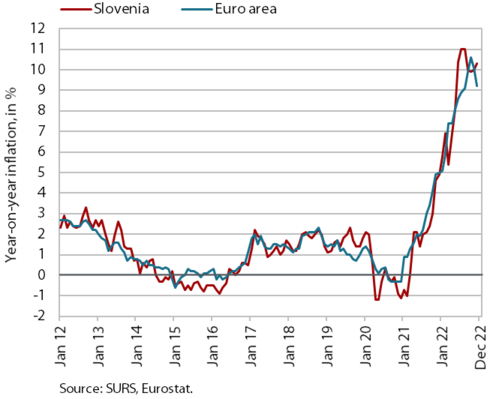
Year-on-year consumer price inflation edged up slightly to 10.3% in December. It was thus higher than in November, mainly due to the stronger increase in service prices, which were 7.2% higher year-on-year. We estimate that this was, in addition to the low base resulting partly from containment measures in force at the end of 2021, also due to higher prices of services in December in communications, restaurants and hotels, recreational and cultural services and health. Last year, the largest upward impact on inflation came from higher prices of food and non-alcoholic beverages (3.1 p.p.). While their year-on-year increase at the end of the year was somewhat lower (18.6%) than in November due to the high base, prices in this group continued to rise significantly month-on-month (by 1.7%, slightly above the monthly average of the previous year). The year-on-year increase in energy prices continued to slow slightly towards the end of the year to around 16% according to our estimate and the contribution to inflation was slightly below 2 p.p. The slowdown in economic activity and reduction of bottlenecks and cost pressures in commodity markets are also contributing to a gradual slowdown in the rise in durable goods prices, which were 8.2% higher year-on-year in December, while the increase in semi-durable goods prices (3.8%) remained relatively modest.
Bond, Q4 2022
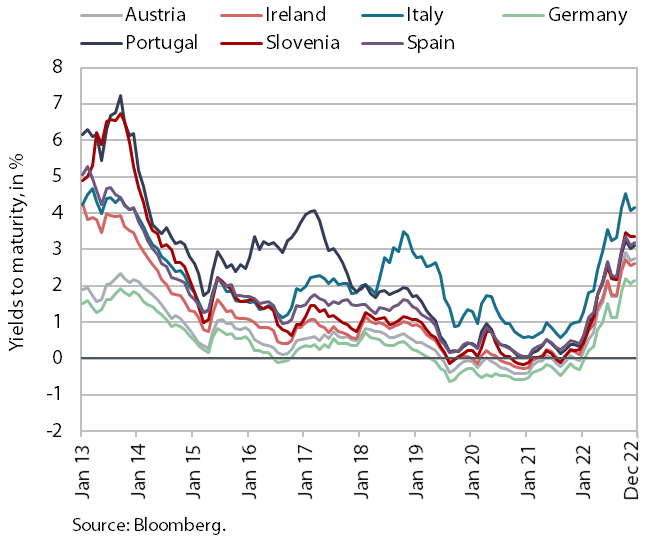
Yields to maturity of euro area government bonds increased again in the last quarter of 2022. This was still mainly due to the high inflation in the euro area and the associated acceleration of monetary policy normalisation. The yield to maturity of the Slovenian government bond was 3.38% in the fourth quarter of last year, the highest level since 2014 and more than 300 basis points higher than in the same period of 2021. The spread to the German bond was 125 basis points, which is 75 basis points higher than a year ago.
Number of registered unemployed, December 2022
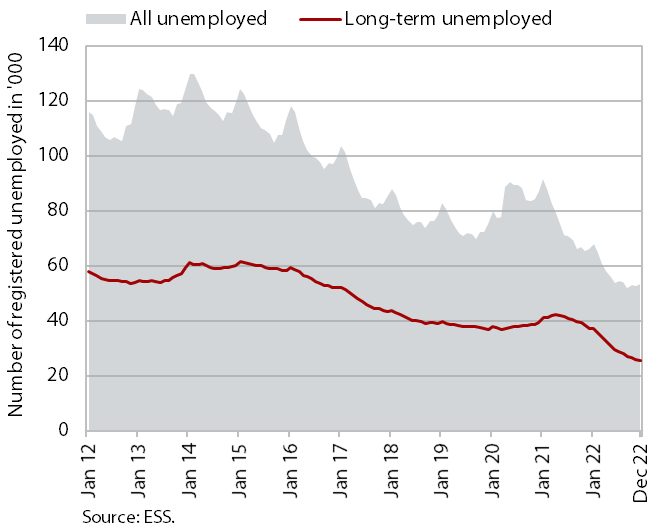
According to the seasonally adjusted data, the monthly decline in the number of registered unemployed was larger in December (-2.2%) than in the previous months. According to the original data, 53,181 people were unemployed at the end of December, 1.2% more than at the end of November. This largely reflects seasonal trends related to a higher inflow into unemployment due to expiration of fixed-term employment contracts. Unemployment was down 19.4% year-on-year. Under conditions of high demand for labour, which is also reflected in the high vacancy rate, the number of long-term unemployed has also been declining since May 2021 – their number was almost one third lower year-on-year in December. The number of unemployed people over 50, who are often long-term unemployed, is also declining – in December, their number was a little less than one fifth lower than a year ago.
Natural gas consumption, December 2022
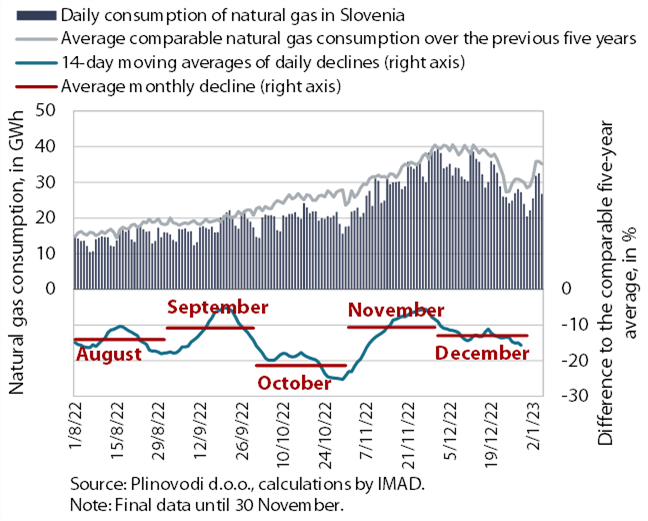
Given the warm weather, natural gas consumption in October was more than a fifth below the comparable average consumption over the last five years. In the last two months of 2022, the gap narrowed again, amounting to 11% and 13%. Part of the industry reacted to the high gas prices by reducing production output and thus consumption. Government measures also contributed to a more rational use of gas. After a warm October, the gap with comparable gas consumption in previous years narrowed towards the end of the year. By mid-November, EU Member States were able to assure that their gas storage capacities were almost full, but since then the storage level has been gradually declining. According to preliminary data, gas consumption in Slovenia from 1 August 2022 to 5 January 2023 was 14% lower than the comparable average consumption over the last five years, which is slightly below the EU recommendations for gas consumption reduction in the overall period between August 2022 and March 2023.
Electricity consumption, December 2022
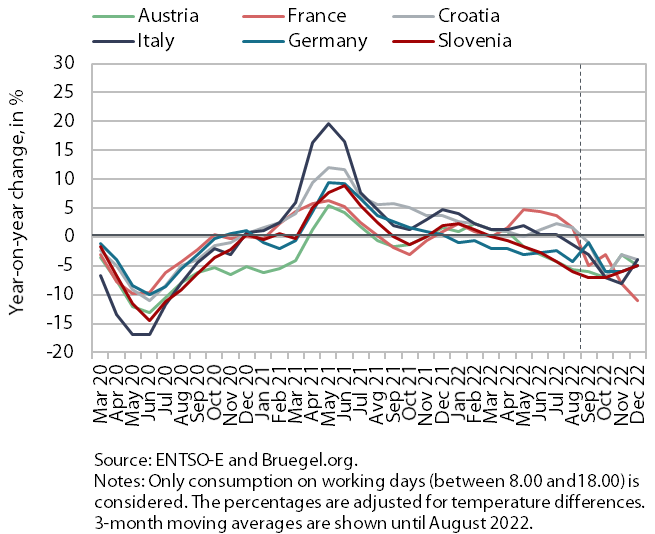
Electricity consumption was 5% lower year-on-year in December. In our estimation, both industrial and household consumption were lower. Due to high electricity prices, in certain energy-intensive industrial companies in particular production volume has been reduced and manufacturing technologies have possibly been modernised to increase energy efficiency. The year-on-year lower household consumption was probably resulting from energy saving and possibly fewer people working from home. Compared to December 2021, consumption was also lower in our main trading partners (-4% in Italy and Croatia, -5% in Austria and Germany and -11% in France).
Value of fiscally verified invoices, in nominal terms, 11–24 December 2022
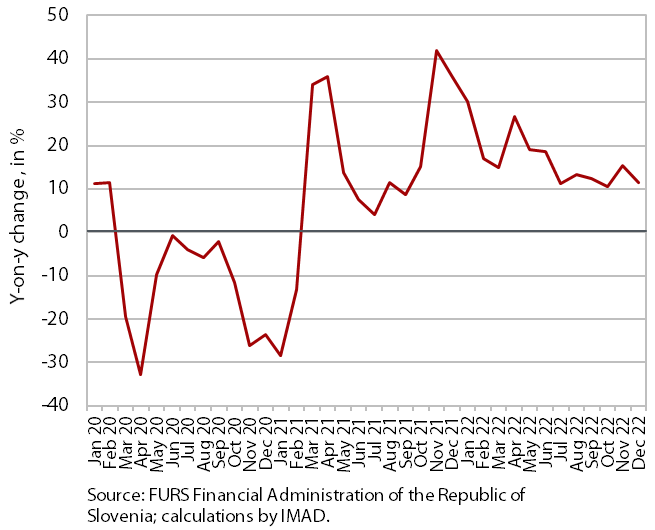
Amid high price growth, the value of fiscally verified invoices between 11 and 24 December 2022 was 12% higher year-on-year in nominal terms and 9% higher than in the same period of 2019. The largest contribution to year-on-year growth, which was slightly lower than that in the last two weeks, came from the 11% nominal growth of turnover in trade, which accounted for more than 80% of the total value of fiscally verified invoices issued. Growth was also significantly influenced by the high nominal turnover growth in accommodation and food service activities (25% overall, 30% in food and beverage service activities), which was partly due to last year’s lower base.
Turnover in trade, October–November 2022
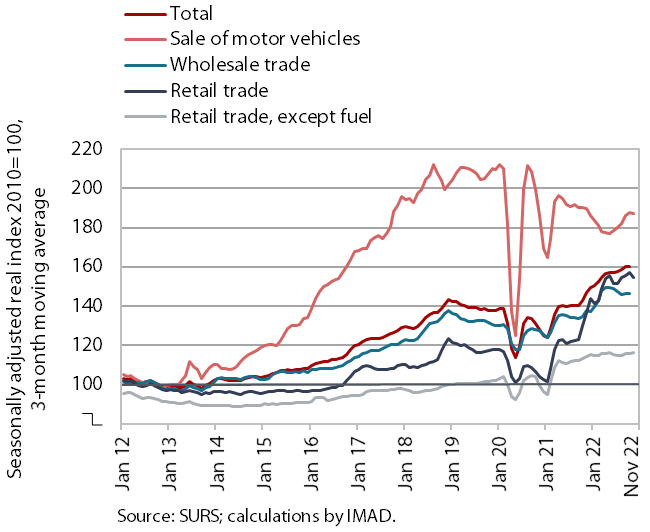
Average turnover in October and November was close to that recorded in the third quarter in real terms. Turnover in retail trade excluding fuel fell in October, partly due to the timing of the holidays, but rose in November, according to preliminary SURS data. The average for both months was similar to Q3. In October and November, turnover was higher year-on-year in retail sales of non-food products, while the sales of food, beverages and tobacco was lower. Turnover in the sale of motor vehicles also remained lower than a year ago, where, after a significant increase in the third quarter, turnover declined in October and, according to preliminary data, also in November. In October, turnover further declined in wholesale trade, where year-on-year growth also continued to weaken.
Turnover in market services, October 2022
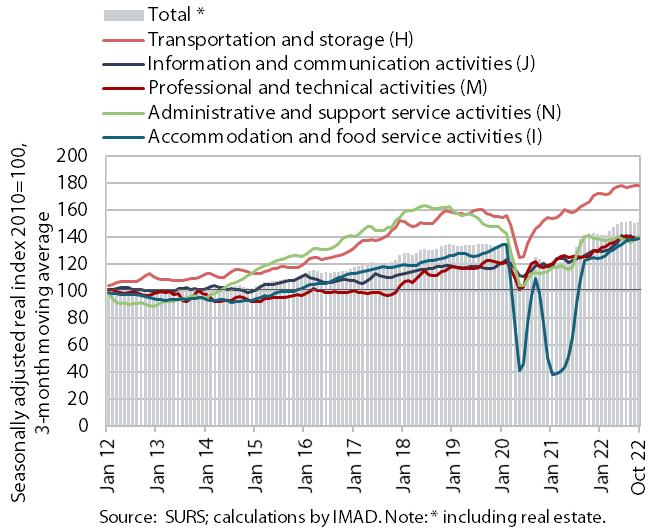
Real income from market services fell in October. It fell in current terms for the second month in a row, this time by 1%, while it was 3.3% higher year-on-year. After two months of sustained growth, turnover in transportation and storage fell again significantly, most markedly in storage. A slightly lower turnover was also recorded in professional and technical activities, with a more pronounced decline in architectural and engineering services. After declining, turnover increased again in accommodation and food service activities. Turnover in information and communication activities increased again, mainly due to higher turnover in computer services from both the domestic and international markets. Turnover growth in administrative and support service activities slowed, with a renewed decline in travel and employment agencies. In the first ten months of last year, turnover was higher year-on-year in all activities than in 2021, whereas travel and employment agencies were still lagging behind the pre-epidemic level (October 2019), by 24% and 14% respectively.
Trade in goods – in real terms, November 2022
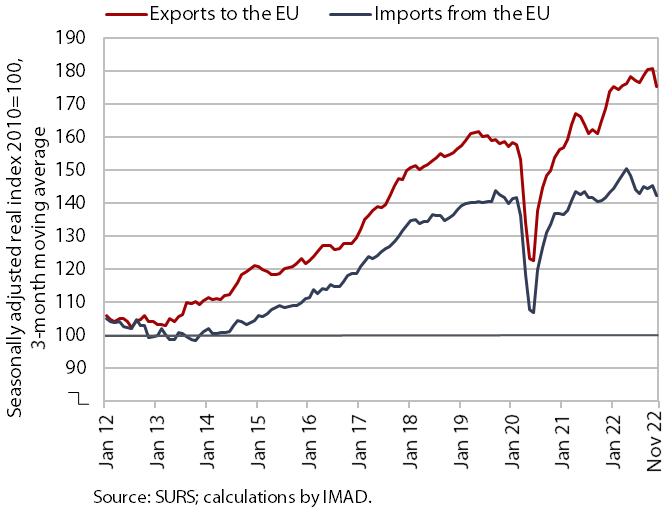
Goods trade with EU countries continued to decrease in November. Real trade in goods with EU countries decreased by around 4% (seasonally adjusted). It was also lower year-on-year. The decline in trade with EU countries is due to uncertainty and low sentiment indicator values in industry and among consumers in some of Slovenia’s main trading partners, notably Germany and Italy. According to initial estimates, trade in intermediate products (excluding petroleum products) in particular has declined in recent months. In the first 11 months, exports to EU countries rose by 5.5% year-on-year and imports by 2.6%. Sentiment in export-oriented industries improved slightly in December, but export orders remained very low given the great uncertainty in the international environment.