Charts of the Week
Charts of the week from 25 to 29 May 2026: economic sentiment, consumer prices, turnover in trade and other charts
In May, the economic sentiment indicator returned to its March level, before the impact of the war in the Middle East became apparent, although it remained slightly below its long-term average. Year-on-year inflation rose for the second consecutive month in May (3.6%). The increase was driven largely by higher energy prices, reflecting a lower base associated with last year's electricity price regulation measures, higher solid fuel prices, and the impact of the war in the Middle East on crude oil and petroleum product prices. Activity in the services sector strengthened in the first quarter. Year-on-year sales were higher in all trade sectors except retail trade in food, beverages and tobacco products, while real turnover increased in all market services except transportation. According to survey data, the number of unemployed persons was 4.9% higher year-on-year in the first quarter, while the number of employed persons was 0.8% lower.
Economic sentiment, May 2026
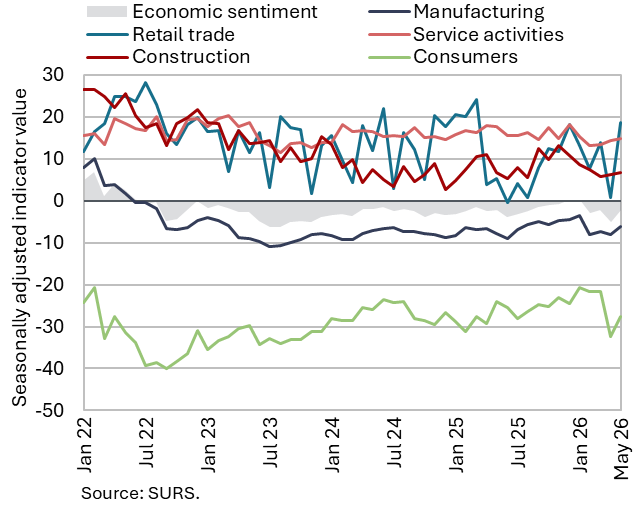
Despite improving in May, the economic sentiment indicator remained slightly below its long-term average. Confidence improved across all sectors, with the strongest increases recorded in trade (where monthly fluctuations tend to be pronounced) and among consumers. Compared with May last year, the overall sentiment indicator remained broadly unchanged, while confidence declined in services and among consumers. The economic sentiment indicator was slightly below its long-term average, as were the confidence indicators in manufacturing and among consumers, whereas the indicators for retail trade, services and construction remained above their long-term averages.
Consumer prices, May 2026
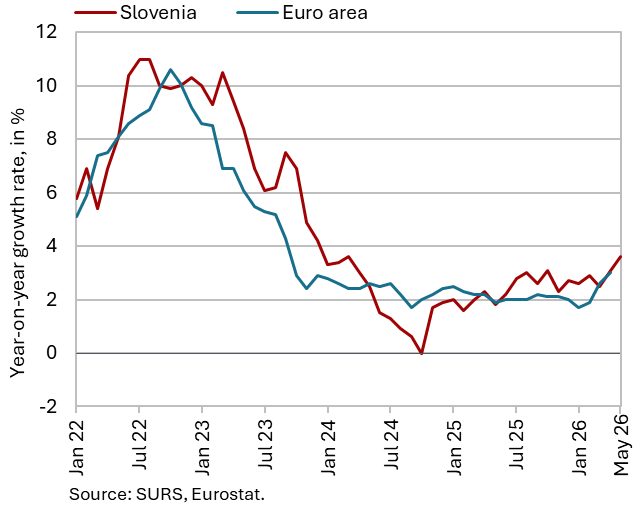
Consumer price inflation increased for the second consecutive month in May, reaching 3.6% (up from 3.1% in April), while prices rose by 0.5% month-on-month. Housing, water, electricity, gas and other fuels continued to make the largest contribution (1.3 p.p.) to year-on-year inflation in May, with prices in this category being 10% higher than a year earlier. This primarily reflected higher energy prices owing to a lower base effect stemming from earlier electricity price regulation measures, the persistently strong growth in solid fuel prices since the beginning of the year, and the impact of the war in the Middle East on crude oil and petroleum product prices (liquid fuels – heating oil). Through higher fuel prices, which were around one-fifth above their level a year earlier, the conflict also contributed significantly to inflation in the transport category (0.8 p.p.). Price growth in the food and non-alcoholic beverages group continued to moderate gradually (0.9%). Prices of semi-durable goods (0.1%) and durable goods (-0.2%) remained broadly unchanged year-on-year. Annual services inflation (3.8%) strengthened by 0.2 p.p. compared with April.
Turnover in trade, March 2026
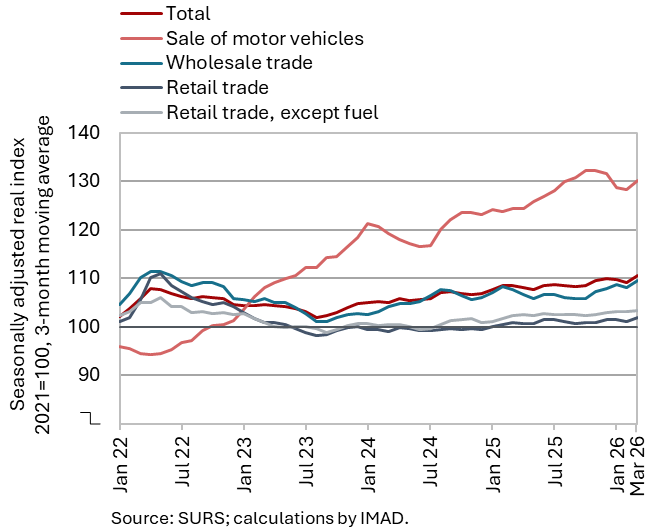
Driven by strong sales growth in March, real turnover across most trade sectors in the first quarter exceeded its level a year earlier. Following declines in the previous three months, turnover in wholesale trade increased markedly in March, while turnover in the sale of motor vehicles rose for the second consecutive month. After declining at the beginning of the year, following relatively strong growth in December, sales in retail trade of food, beverages and tobacco products and in retail trade of non-food products also increased in March (all seasonally adjusted). Compared with the first quarter last year, sales increased across all trade sectors except retail trade in food, beverages and tobacco products. Year-on-year growth reached 5% in the sale of motor vehicles, while wholesale trade and retail trade of non-food products each recorded growth of 3%.
Turnover in market services, March 2026
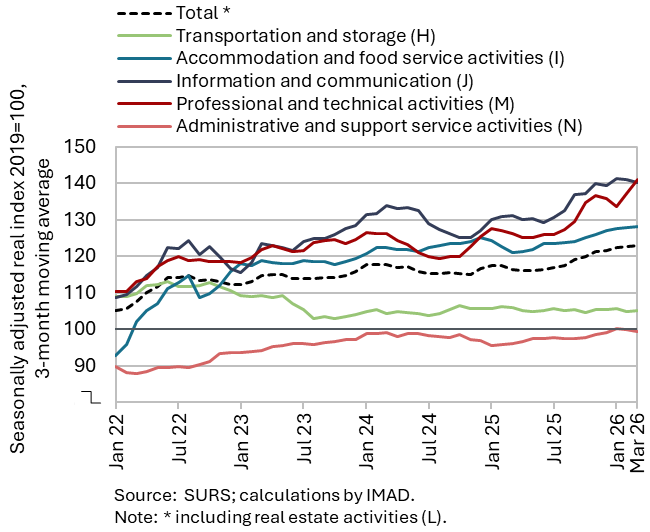
Total real turnover in market services continued to rise in the first quarter (seasonally adjusted) and was also higher year-on-year. Turnover in information and communication has been strengthening since the second half of last year. Growth slowed somewhat in the first quarter due to a decline in turnover in telecommunications activities. Following strong growth in the fourth quarter of last year, growth also moderated in professional and technical activities and accommodation and food service activities, although turnover in both sectors has been increasing since the second half of last year. In transportation and storage, turnover declined slightly in the first quarter but has broadly stagnated since the end of 2024. In administrative and support service activities, turnover has been gradually increasing since the beginning of last year. Growth moderated in the first quarter, and turnover remained slightly below its comparable 2019 level (all seasonally adjusted). Total real turnover was 5.5% higher year-on-year in the first quarter; only in transportation was it slightly lower than a year earlier (by 0.6%).
Active and inactive population, Q1 2026
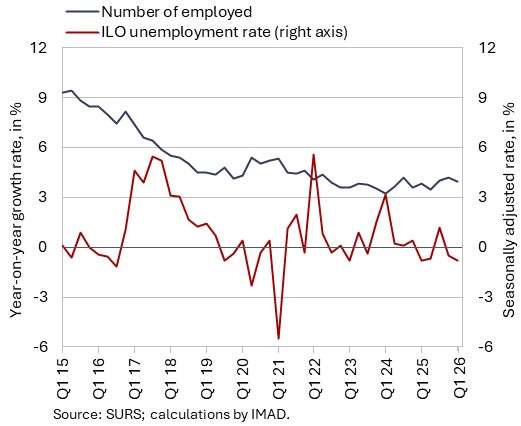
According to survey data, the number of unemployed persons increased year-on-year in the first quarter of this year, while the number of persons in employment declined. According to survey data, the number of unemployed persons reached 43,000, up 4.9% on the first quarter of 2025. This increase was driven primarily by a decline in employment in manufacturing. The survey unemployment rate (4.1%) was also slightly higher year-on-year (by 0.1 p.p.).
In the first quarter of this year, the number of persons in employment was lower year-on-year (–0.8%), reflecting declines in the numbers of employees in paid employment, self-employed persons and unpaid family workers, while the number of student workers increased.